FOTO
![]()
The FOTO (Fourier Transform Textural Ordination) method uses a principal component analysis (PCA) on radially averaged 2D Fourier spectra to characterize (grayscale) image texture. The FOTO method was described by Couteron et al. 2005 to quantify canopy stucture in relation to biomass and biodiversity. More recently, the code base of this package was used in a similar study by Solorzano et al. 2018. Although the techniques as presented in these papers is applied on a canopy level, the principle works on images of all types.
Please cite the software in publication as: Koen Hufkens (2019). foto: an R implementation of the “fourier transform textural ordination” method. https://doi.org/10.5281/zenodo.3337885
Installation
stable release
To install the current stable release use a CRAN repository:
install.packages("foto")
library("foto")
development release
To install the development releases of the package run the following commands:
if(!require(remotes)){install.packages("remotes")}
remotes::install_github("bluegreen-labs/foto")
library("foto")
Vignettes are not rendered by default, if you want to include additional documentation please use:
if(!require(remotes)){install.packages("remotes")}
remotes::install_github("bluegreen-labs/foto", build_vignettes = TRUE)
library("foto")
Use
To classify image texture using the FOTO algorithm use the foto()
function. The foto() routine returns a nested list with the source
data (aggregated zones used and fourier components used in the PCA
analysis) and a final colour image consisting of the three major
principal components for every pixel.
detailed parameter description (click to expand)
| Parameter | Description |
|---|---|
| x | a raster layer (stack or brick) |
| window_size | a window size in pixels |
| plot | plot output (TRUE / FALSE) |
| norm_spec | normalize the radial spectrum (TRUE / FALSE) |
| method | “zones” or “mw” (i.e. moving window) |
Zones
The original implementation used discrete zones (blocks of x pixels wide, window_size parameter) to classify an image. This original implementation is the default, and the least computationally intensive, as it effectively reduces to resolution of the orignal data. In short, data is aggregated at the size of the specified window.
An example analysis is run below. In the resulting image pixels with a similar colour have a similar texture. The analysis is run on a historical image of plantations near Yangambi, DR Congo, as recovered in the COBECORE project. The regular pattern of planted trees is picked up readily by the algorithm.
# load the library
library(foto)

# load demo data
r <- raster::raster(system.file("extdata", "yangambi.png",
                          package = "foto",
                          mustWork = TRUE))

# classify pixels using zones (discrete steps)
output <- foto(r,
     plot = TRUE,
     window_size = 25,
     method = "zones")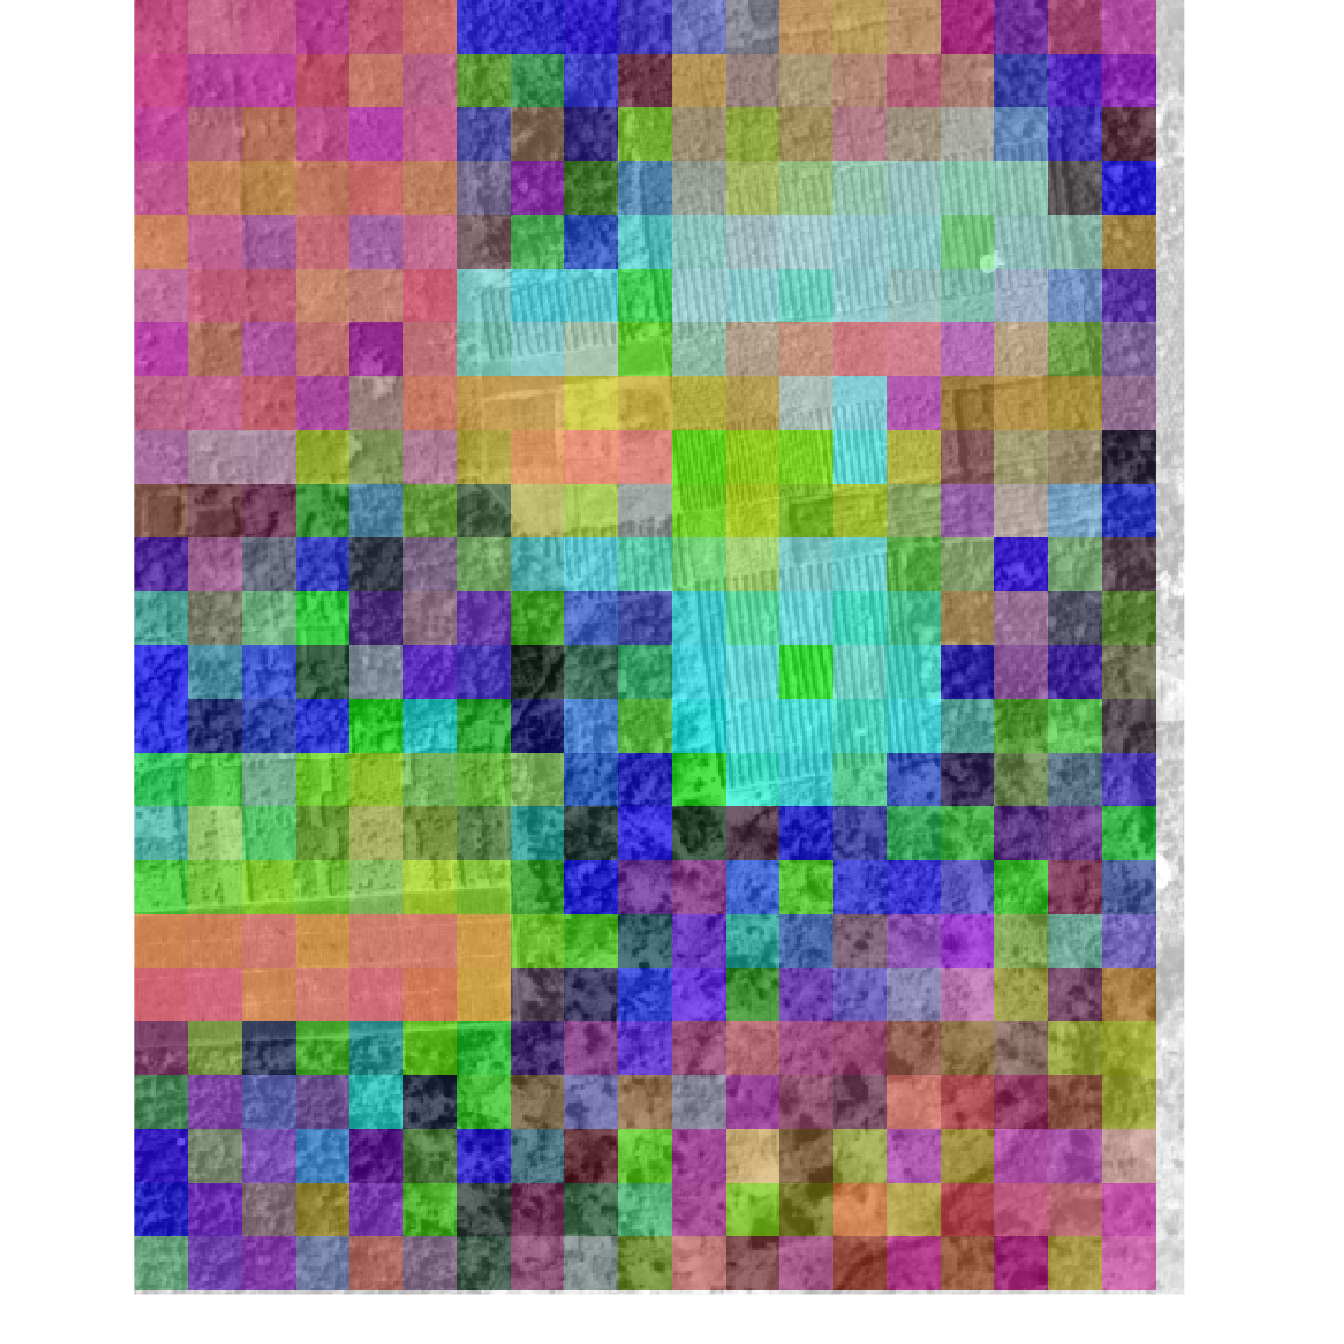
# print data structure
print(names(output))
#> [1] "zones"          "radial_spectra" "rgb"
Moving window
To maintain the resolution of the original image a moving window approach can be used (method = “mw”). This approach overlays a window of size x (window_size parameter) on every pixel in the image and applies the FOTO methodology. This obviously represents a considerable computational burden and should be used with caution. An example is given below for a smaller subsection of the processed image above. The output format of the moving window analysis is consistent with that of the zoned approach.
# crop the image for speed
r <- crop(r, extent(1,100,1,100))

# crop the image
output <- foto(r,
     plot = TRUE,
     window_size = 25,
     method = "mw")
#> A moving window approach is computationally intensive.
#> This might take a while.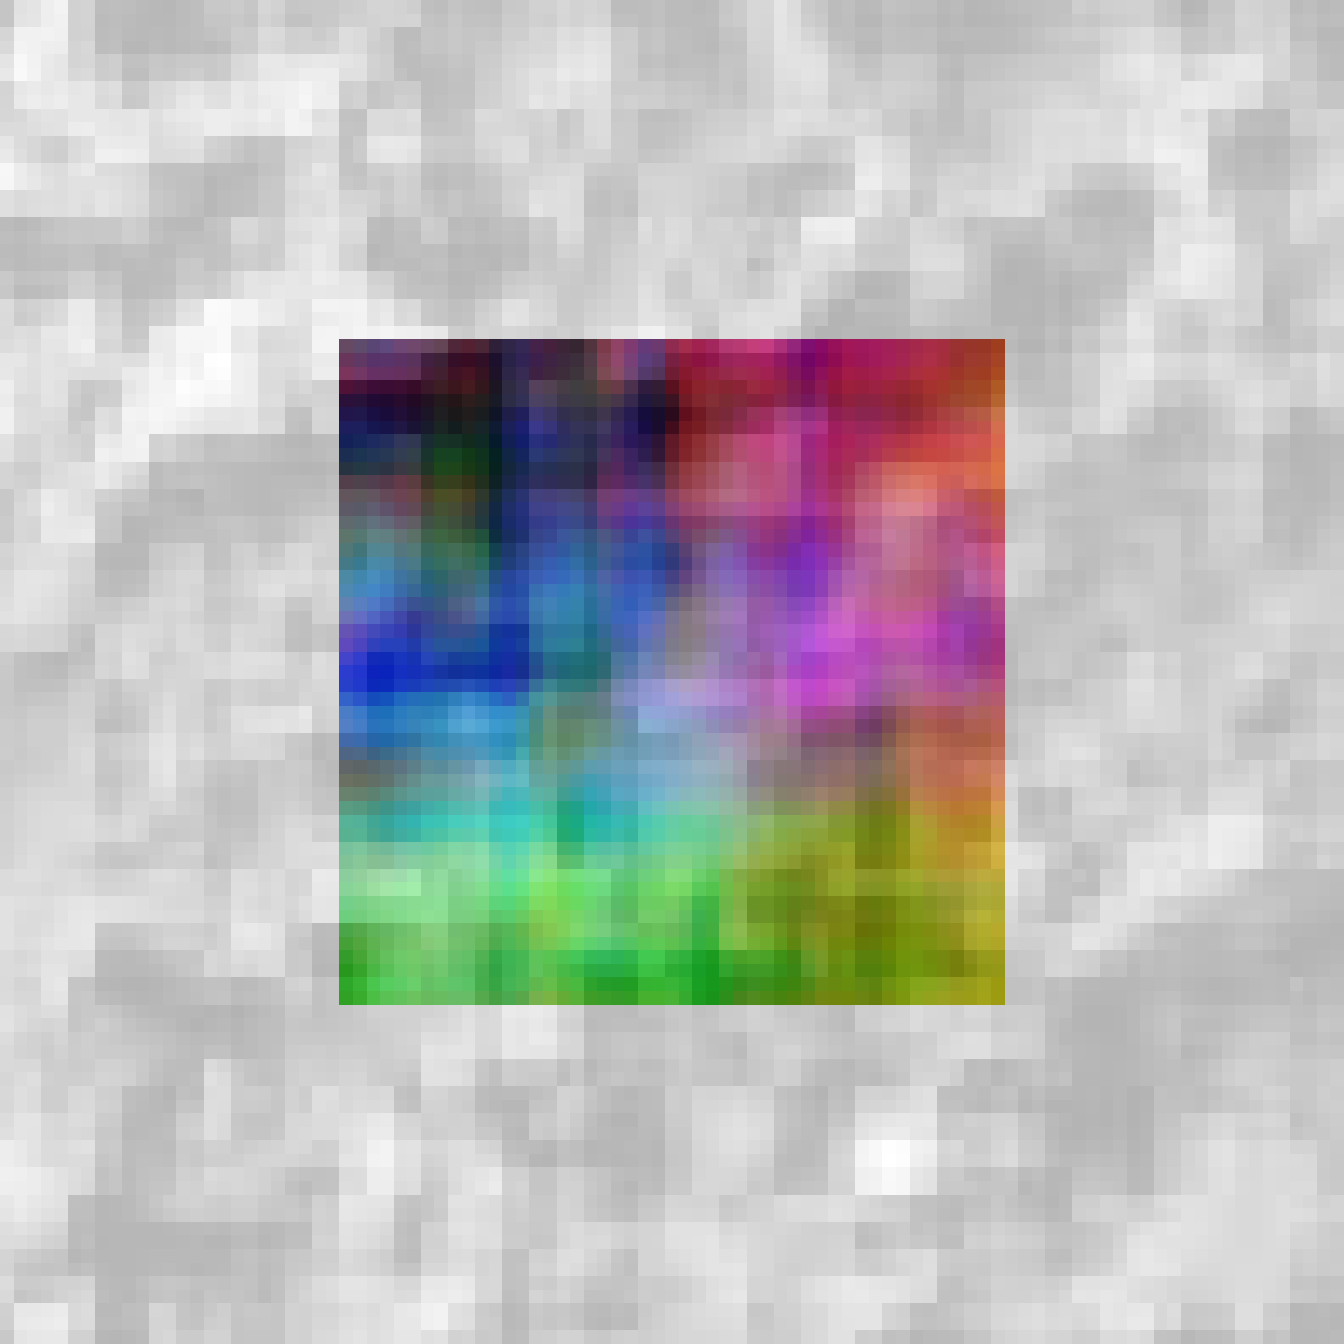
Partitioned normalization
Partitioned normalization as described in Barbier et al. 2010 is not provided but easily accomplished once all images are processed. I refer to this paper for the appropriate routines.
References
-
Couteron P, Pelissier R, Nicolini E a., Paget D (2005) Predicting tropical forest stand structure parameters from Fourier transform of very high-resolution remotely sensed canopy images. Journal of Applied Ecology, 42, 1121–1128.
-
Barbier N, Couteron P, Proisy C, Malhi Y, Gastellu-Etchegorry J-P (2010) The variation of apparent crown size and canopy heterogeneity across lowland Amazonian forests. Global Ecology and Biogeography, 19, 72–84.
-
Solórzano JV, Gallardo-cruz JA, González EJ et al. (2018) Contrasting the potential of Fourier transformed ordination and gray level co-occurrence matrix textures to model a tropical swamp forest ’ s structural and diversity attributes. Journal of Applied Remote Sensing, 12, 036006.
Acknowledgements
This package is supported through the Belgian Science Policy office COBECORE project (BELSPO; grant BR/175/A3/COBECORE).

