DConsole
DConsole or The Console is a real-time console that allows to:
- Run scripts.
- Access and modify fields and objects.
- Call registered functions.
- Monitor fields.
- Customize appearence.
- Profile the app in realtime.
- Register new commands that respond to user input.
Latest Changes - 5.0.0
- Luxe support added
For more changes or other versions, see CHANGELOG.
Currently supported targets:
- Openfl - flash
- Openfl - cpp (working with -Dlegacy flag)
- Openfl - neko (working with -Dlegacy flag)
- Luxe - Web
- Luxe - Windows
Donsole-online
You can try dconsole on this repo github pages.
Install
haxelib install dconsole
Getting Started
Using dconsole is straightforward:
import pgr.dconsole.DC;

DC.init();
DC.log("This text will be logged.");
DC.registerFunction(this.testFunction, "myfunction");
DC.registerObject(this, "myobject");
DC.registerClass(Math, "Math");
To show the console, press TAB, then type "help" or "commands" to see what commands are available, also "objects" and "functions" are useful commands to show registered objects and functions.
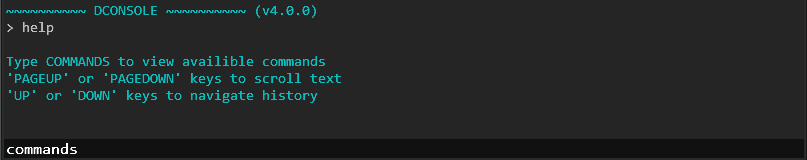
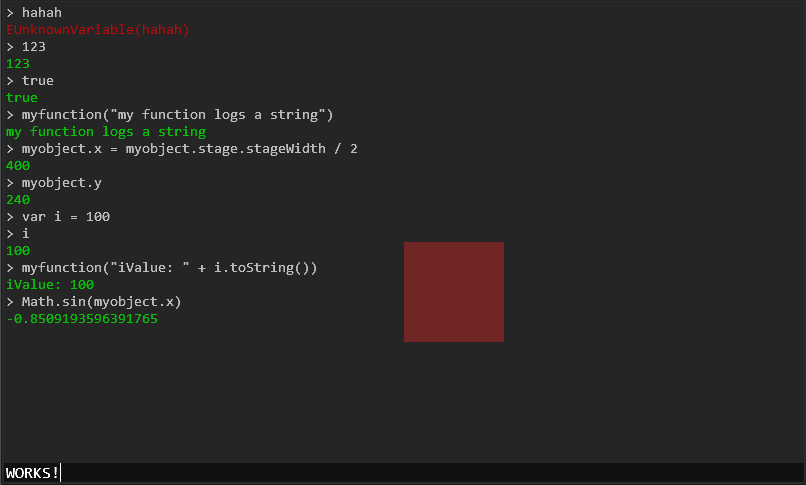
The console can be used to control your application, accessing registered objects and functions in realtime without having to re-compile. Its also possible to evaluate complex expressions and scripts using haxe sintax.
Monitor
The monitor allows you to register fields and monitor their value in real time. For example, to monitor a display object x position:
DG.monitorField(player, "x", "playerX"); Pressing CTRL + TAB brings up the monitor that shows the variable updated in real time
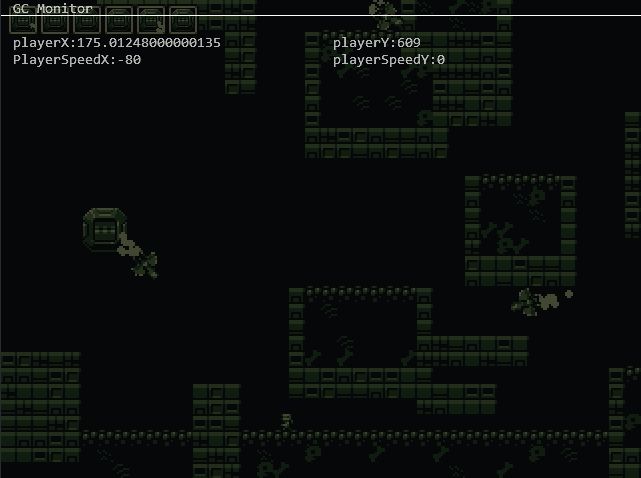
The screenshot shows monitor being used in Adam Atomic's Mode demo.
Profiler
The profiler is lightweight and portable tool that shows:
- What code is eating more cpu.
- How many times is some code executed inside other code block.
- How much time code takes to execute (benchmark)
- Other statistics not shown by default like absolute elapsed, min, max, totalInstances etc..
To sample a code block do:
DC.beginProfile("SampleName");
// Code goes here
DC.endProfile("SampleName");
Toggling the profiler with SHIFT + TAB shows real-time statistics that are updated according to refresh rate.
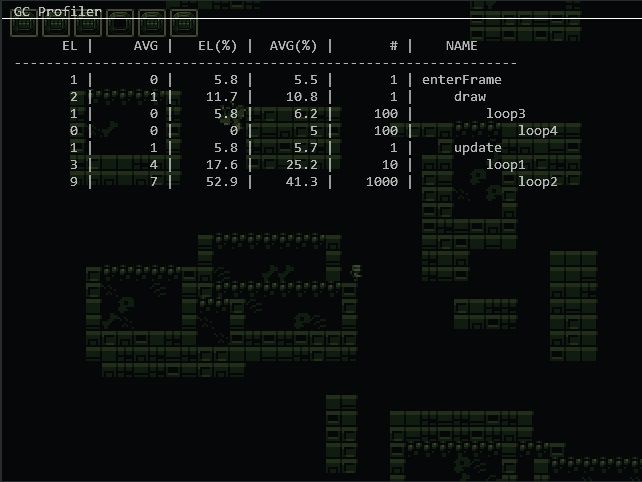
The screenshot shows the profiler using multiple nested samples, idents are used to vizualize the samples hierarchy.
- EL elapsed milliseconds
- AVG average elapsed milliseconds
- EL(%) elapsed percentage
- AVG(%) average elapsed percentage
- # Occurrences of sample inside root sample
-
Name Sample name
HTML5 / JS (Experimental)
DConsole can also run on html5 / javascript using jquery-terminal to process input and log console output (who needs web-kit console right?)
- Add jquery-terminal to your html page.
- Add the tag
<div id="console"/>inside<body></body> -
Add the following script
<script src="project_name.js">):<script src="http://code.jquery.com/jquery-2.1.1.min.js" ></script> <script src="jquery.terminal-0.8.8.min.js"></script> <script> terminal = $('#console').terminal(function(command, term) { if (command !== '') { pgr.dconsole.DC.eval(command); } else { term.echo(''); } }, { greetings: false, name: 'dconsole', width: "100%", height: "200", prompt: '> ', }); document.addEventListener('console_log', function(evt) { terminal.echo(evt.detail.data, { finalize: function(div) { div.css("color", "#" + evt.detail.color); } }); }); </script>
Notes: dead code elimination must be off -dce no, otherwise problems may occur. You can also refer to this repo github pages github pages to see how to use dconsole with html5.
Tips and Tricks
- DC.init(100) will start the console with 100% height.
- DC.setVerboseErrors(true) prints stack information when erros occur.
- Use DC.registerCommand(...) to add custom commands.
- Use DC.registerClass(...) to enable classes to be used from the console.
Suggestions / Comments / Bugs
Email me suggestions, comments, bug reports etc..
Or create a new issue (even better).


