UpSet.js
![]()
UpSet.js is a JavaScript re-implementation of UpSetR which itself is based on UpSet to create interactive set visualizations for more than three sets. The core library is written in React but provides also bundle editions for plain JavaScript use. The UpSetJS React component is implemented as a pure functional component solely depending on the given properties.

More details about UpSet.js can be found on the Medium article series about it:
- UpSet.js — The UpSet.js Ecosystem
- UpSet.js — JavaScript Tutorial
- UpSet.js — Behind the (technical) Scenes
This monorepo contains following packages:
-
@upsetjs/model the data model definition of UpSet.js
-
@upsetjs/react the main UpSet.js React component
-
@upsetjs/math utility package for computing stats
-
@upsetjs/addons extensions to the React component for rendering boxplots
-
@upsetjs/bundle zero dependency bundle of the react and addons component using Preact
-
@upsetjs/plots VEGA plot helper to be linked with UpSet.js
-
@upsetjs/app example application to explore datasets using UpSet.js with import and export features
-
@upsetjs/vue vue wrapper based on the bundled version
In addition, there are the following sibling repositories and projects
-
upsetjs_r R HTMLWidget wrapper around UpSet.js
-
upsetjs_jupyter_widget Jupyter Widget wrapper around UpSet.js
-
upsetjs_powerbi_visuals PowerBI Custom Visuals around UpSet.js
-
upsetjs_tableau_extension Tableau extension around UpSet.js
-
upset-js Observable HQ wrapper around UpSet.js
Usage and Installation
React
npm install @upsetjs/react react react-domimport React from 'react';
import UpSetJS, { extractCombinations, ISetLike } from '@upsetjs/react';
const elems = [
{ name: 'A', sets: ['S1', 'S2'] },
{ name: 'B', sets: ['S1'] },
{ name: 'C', sets: ['S2'] },
{ name: 'D', sets: ['S1', 'S3'] },
];
const { sets, combinations } = extractCombinations(elems);
<UpSetJS sets={sets} combinations={combinations} width={500} height={300} />;with stored selection
const UpSetJSSelection = (props: any) => {
  [selection, setSelection] = React.useState(null as ISetLike<any> | null);

  return <UpSetJS {...props} selection={selection} onHover={setSelection} />;
};

<UpSetJSSelection sets={sets} combinations={combinations} width={500} height={300} />;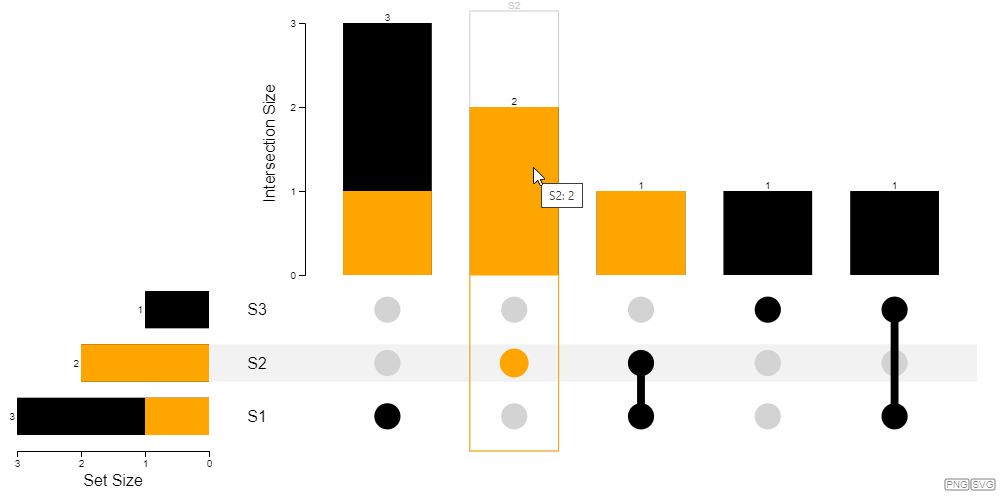
Bundled version
npm install @upsetjs/bundleimport { extractCombinations, render } from '@upsetjs/bundle';
const elems = [
{ name: 'A', sets: ['S1', 'S2'] },
{ name: 'B', sets: ['S1'] },
{ name: 'C', sets: ['S2'] },
{ name: 'D', sets: ['S1', 'S3'] },
];
const { sets, combinations } = extractCombinations(elems);
render(document.body, { sets, combinations, width: 500, height: 300 });with stored selection
let selection = null;

function onHover(set) {
  selection = set;
  rerender();
}

function rerender() {
  const props = { sets, combinations, width: 500, height: 300, selection, onHover };
  render(document.body, props);
}

rerender();
see also
Venn Diagrams
For comparison and convenience reasons UpSet.js also has a Venn Diagram component for rendering two or three sets.
import React from 'react';
import { VennDiagram, extractSets, ISetLike } from '@upsetjs/react';

const elems = [
  { name: 'A', sets: ['S1', 'S2'] },
  { name: 'B', sets: ['S1'] },
  { name: 'C', sets: ['S2'] },
  { name: 'D', sets: ['S1', 'S3'] },
];

const sets = extractSets(elems);

<VennDiagram sets={sets} width={500} height={300} />;
with stored selection
const VennDiagramSelection = (props: any) => {
  [selection, setSelection] = React.useState(null as ISetLike<any> | null);

  return <VennDiagram {...props} selection={selection} onHover={setSelection} />;
};

<VennDiagramSelection sets={sets} width={500} height={300} />;
import { extractSets, renderVennDiagram } from '@upsetjs/bundle';

const elems = [
  { name: 'A', sets: ['S1', 'S2'] },
  { name: 'B', sets: ['S1'] },
  { name: 'C', sets: ['S2'] },
  { name: 'D', sets: ['S1', 'S3'] },
];

const sets = extractSets(elems);

renderVennDiagram(document.body, { sets, width: 500, height: 300 });
with stored selection
let selection = null;

function onHover(set) {
  selection = set;
  rerender();
}

function rerender() {
  const props = { sets, width: 500, height: 300, selection, onHover };
  renderVennDiagram(document.body, props);
}

rerender();
Karnaugh Maps
UpSet.js also has a variant of a Karnaugh Map for rendering set intersections in a dense matrix way.
import React from 'react';
import { KarnaughMap, extractSets, ISetLike } from '@upsetjs/react';

const elems = [
  { name: 'A', sets: ['S1', 'S2'] },
  { name: 'B', sets: ['S1'] },
  { name: 'C', sets: ['S2'] },
  { name: 'D', sets: ['S1', 'S3'] },
];

const sets = extractSets(elems);

<KarnaughMap sets={sets} width={550} height={300} />;
with stored selection
const KarnaughMapSelection = (props: any) => {
  [selection, setSelection] = React.useState(null as ISetLike<any> | null);

  return <KarnaughMap {...props} selection={selection} onHover={setSelection} />;
};

<KarnaughMapSelection sets={sets} width={550} height={300} />;
import { extractSets, renderKarnaughMap } from '@upsetjs/bundle';
const elems = [
{ name: 'A', sets: ['S1', 'S2'] },
{ name: 'B', sets: ['S1'] },
{ name: 'C', sets: ['S2'] },
{ name: 'D', sets: ['S1', 'S3'] },
];
const sets = extractSets(elems);
renderKarnaughMap(document.body, { sets, width: 550, height: 300 });with stored selection
let selection = null;

function onHover(set) {
  selection = set;
  rerender();
}

function rerender() {
  const props = { sets, width: 550, height: 300, selection, onHover };
  renderKarnaughMap(document.body, props);
}

rerender();
Interactivity
By specifying onHover and selection UpSet.js is fully interactive. As an alternative there is also the onClick property.
Queries
Similar to the original UpSetR, UpSet.js allows to specify queries by a set of elements which are then highlighted in the plot. The first query is shown in full detail while others are shown using small indicators.
const queries = [
  { name: 'Q1', color: 'steelblue', elems: elems.filter(() => Math.random() > 0.7) },
  { name: 'Q2', color: 'red', elems: elems.filter(() => Math.random() > 0.8) },
];

render(document.body, { sets, width: 1000, height: 500, queries });
see also
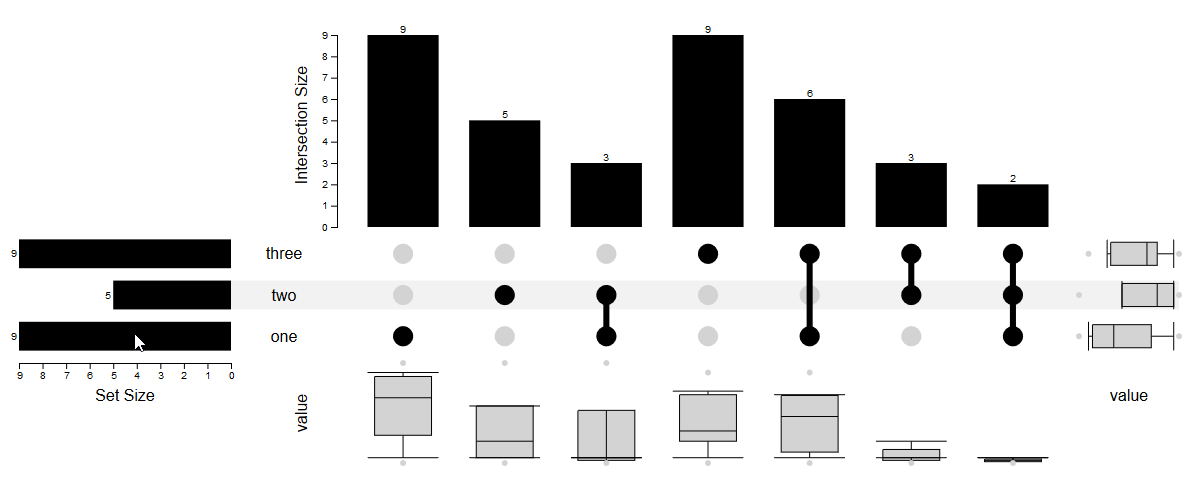
Addons
Similar to the original UpSet and UpSetR, UpSet allows to render boxplot for showing numerical aggregates of sets and set combinations.
import { extractSets, render, boxplotAddon } from '@upsetjs/bundle';

const elems = [
  { name: '1', sets: ['one', 'two', 'three'], value: Math.random() },
  { name: '2', sets: ['one', 'two'], value: Math.random() },
  { name: '3', sets: ['one'], value: Math.random() },
  { name: '4', sets: ['two'], value: Math.random() },
  { name: '5', sets: ['one', 'two', 'three'], value: Math.random() },
  { name: '6', sets: ['three'], value: Math.random() },
  { name: '7', sets: ['one', 'three'], value: Math.random() },
  { name: '8', sets: ['one', 'three'], value: Math.random() },
  { name: '9', sets: ['three'], value: Math.random() },
  { name: '10', sets: ['two', 'three'], value: Math.random() },
  { name: '11', sets: ['one'], value: Math.random() },
  { name: '12', sets: ['one', 'three'], value: Math.random() },
  { name: '13', sets: ['one', 'three'], value: Math.random() },
];
const sets = extractSets(elems);

render(document.body, {
  sets,
  width: 500,
  height: 300,
  setAddons: [boxplotAddon('value', elems)],
  combinationAddons: [boxplotAddon('value', elems, { orient: 'vertical' })],
});
Plots
Similar to the original UpSet and UpSetR, support plots showing histograms, scatterplots, bar charts, or pie charts of attributes of the elements can be created and linked.
The @upsetjs/plots package contains wrappers around VEGA plots which support selection and queries, to be easily linked with UpSet.js plots.

UpSet.js App
The UpSet.js App is an web application for exploring sets and set intersections. It is the counterpart to the original UpSet and UpSet2. The app is deployed at https://upset.js.org/app.

UpSetJS
The most relevant and required properties of the UpSetJS component are:
{
  width: number;
  height: number;

  sets: ISet<T>[];
  combinations?: ISetCombination<T>[] | GenerateCombinationOptions<T>;

  selection?: ISetLike<T> | readonly T[] | null;

  onHover?(selection: ISetLike<T> | null): void;
  onClick?(selection: ISetLike<T> | null): void;

  queries?: UpSetQuery<T>[];
}
Data
UpSetJS requires sets and optionally combinations of sets as input. There are some utility function to help creating the required data structures:
-
extractSets<T extends { sets: string[] }>(elements: readonly T[]): ISet<T>[]given an array of elements where each is having a property called.setscontaining a list of set names in which this element is part of. e.g.{ sets: ['Blue Hair', 'Female']}. The return value is a list of sets in the required data structures and having a.elemswith an array of the input elements. -
asSets<T, S extends { name: string; elems: readonly T[] }>(sets: readonly S[]): (S & ISet<T>)[]extends the given basic set objects (nameandelems) with the required attributes forUpSetJS -
generateCombinations<T>(sets: ISets<T>, { type = 'intersection', min = 0, max = Infinity, empty = false } = {}): ISetCombination<T>[]one needs to generate the list of the combinations to show in case of customized sorting or filtering. This function takes the array of sets as input and computed all possible set intersections (aka. power set). The options allow to limit the generation to skipemptyset combinations or enforce a minimum/maximum amount of sets in the set combinations. There are three types:intersectionto generate set intersections,unionfor set unions, anddistinctIntersectionfor set intersections that do not appear in any other set
Integration
Observable HQ
A ObservableHQ wrapper is located at upset-js
data = fetch(
  'https://raw.githubusercontent.com/upsetjs/upsetjs/main/packages/bundle/example/got.json'
).then(r => r.json())
}
import { extractSets, UpSetJSElement, generateIntersections } from '@sgratzl/upset-js';sets = extractSets(data);intersections = generateIntersections(sets);viewof selection = UpSetJSElement(sets, intersections)selection ? selection.elems.map((d) => d.name) : 'None';An advanced example showing all datasets from the live UpSet demo is located at ObservableHQ
R/RMarkdown/RShiny HTMLWidget

A R wrapper using HTMLWidgets is located at upset_r. The API follows the building pattern using the chaining operator %>%.
In contrast to the original UpsetR implementation it focusses on the UpSet plot itself only. However it supports interactivity either using custom Shiny events or HTMLWidgets Crosstalk. See also Shiny examples.
# CRAN version
install.packages('upsetjs')
# or
devtools::install_url("https://github.com/upsetjs/upsetjs_r/releases/latest/download/upsetjs.tar.gz")
library(upsetjs)
listInput <- list(one = c(1, 2, 3, 5, 7, 8, 11, 12, 13), two = c(1, 2, 4, 5, 10), three = c(1, 5, 6, 7, 8, 9, 10, 12, 13))
upsetjs() %>% fromList(listInput) %>% interactiveChart()
see also Basic.Rmd
Jupyter Widget
A Jupyter Widget wrapper is located at upsetjs_jupyter_widget.
pip install upsetjs_jupyter_widget
jupyter labextension install @jupyter-widgets/jupyterlab-manager@3.0.0-alpha.0
from upsetjs_jupyter_widget import UpSetJSWidgetw = UpSetJSWidget[str]()
w.from_dict(dict(one = ['a', 'b', 'c', 'e', 'g', 'h', 'k', 'l', 'm'], two = ['a', 'b', 'd', 'e', 'j'], three = ['a', 'e', 'f', 'g', 'h', 'i', 'j', 'l', 'm']))
w
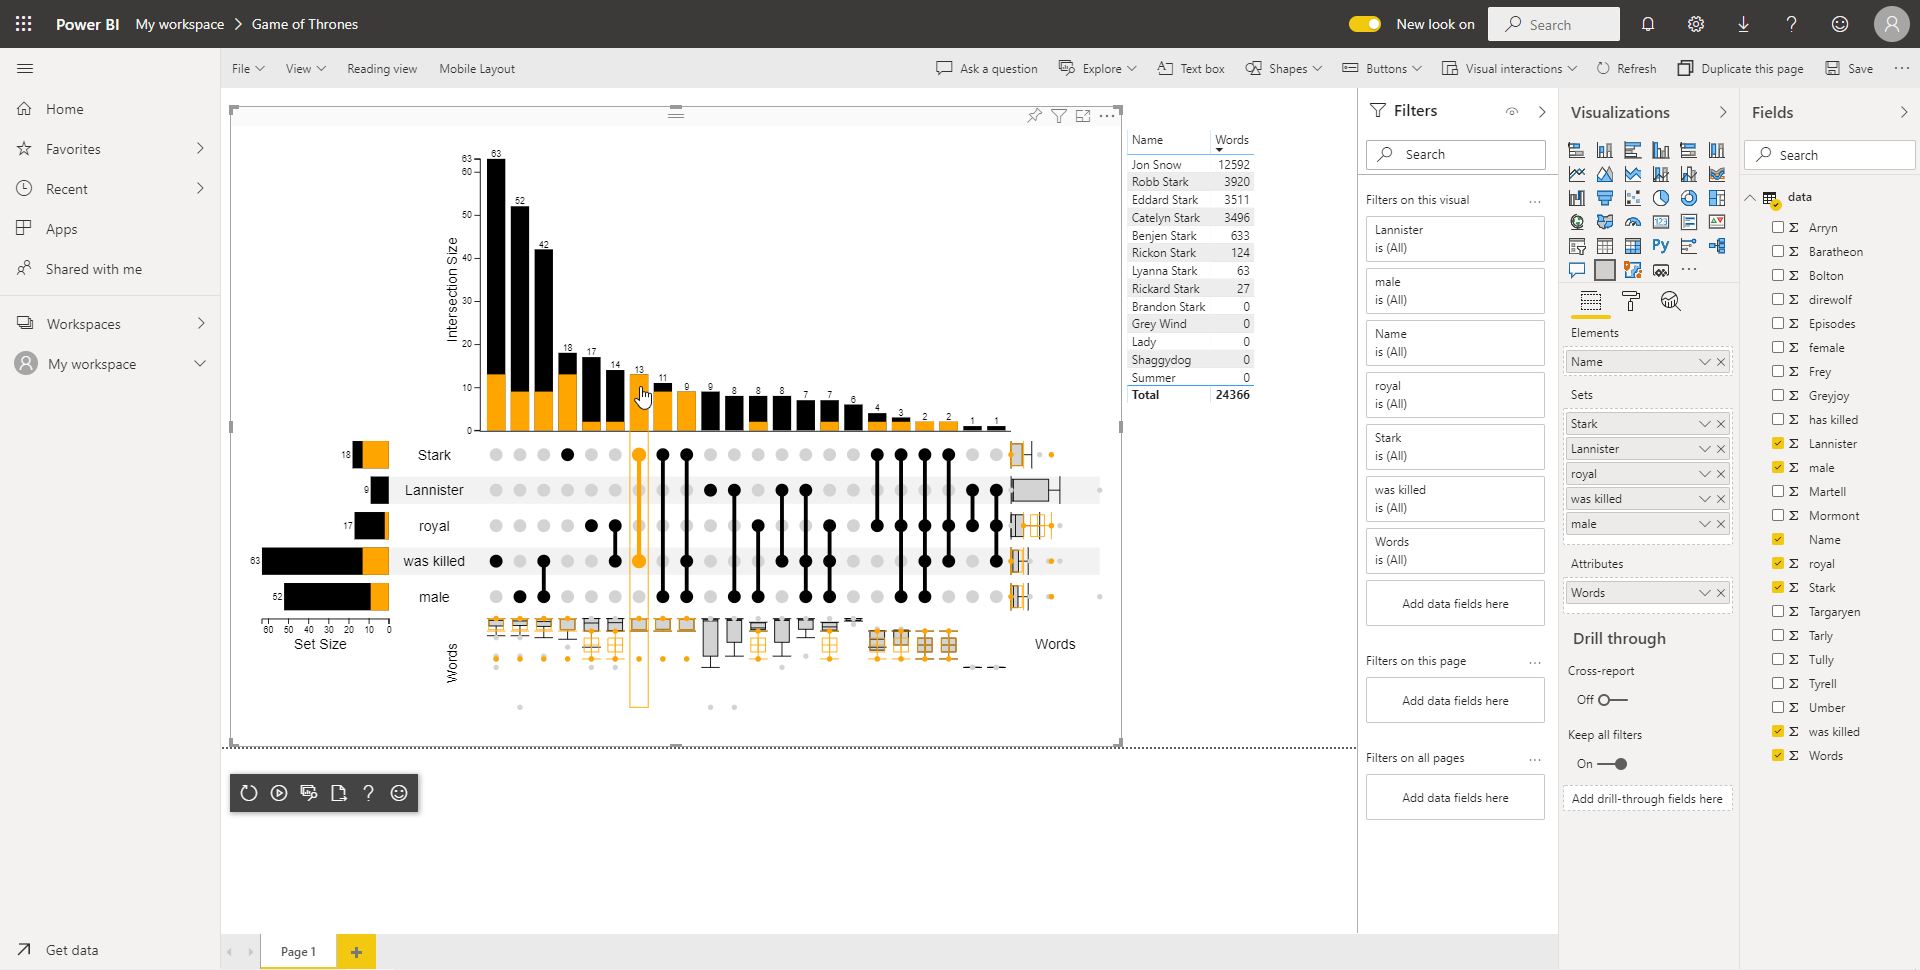
PowerBI
A PowerBI Custom Visual is located at upsetjs_powerbi_visuals.
Download the latest package from https://upset.js.org/integrations/powerbi/upsetjs.pbiviz and install into your PowerBI environment.
Another PowerBI Custom Visual for rendering Venn Diagrams can be downloaded from https://upset.js.org/integrations/powerbi/upsetjs_venn.pbiviz.

Tableau
A Tableau extension is located at upsetjs_tableau_extension.
- Download the extension description file at upsetjs.trex
- Create a new dashboard and show at least one sheet in the dashboard
- Follow https://tableau.github.io/extensions-api/docs/trex_overview.html and choose the downloaded file
- Use the
configurebutton or theconfiguremenu entry to specify the input data

Dev Environment
npm i -g yarn
yarn install
Commands
Testing
yarn testLinting
yarn lintBuilding
yarn install
yarn build
Release
Release-it is used:
yarn releaseRelease Policy
to simplify this monorepo together with its siblings the following strategy for versioning is used: Major and Minor versions should be in sync. Patch version are independent except the 10 potent. Thus, a next unified patch release should be increased to the next 10 potent.
e.g.,
upsetjs -> 0.5.0, upsetjs_r -> 0.5.0 good
upsetjs -> 0.5.2, upsetjs_r -> 0.5.3 good since 0.5.02 ~ 0.5.03
upsetjs -> 0.5.10, upsetjs_r -> 0.5.5 bad should be upsetjs_r -> 0.5.10, too
Privacy Policy
UpSet.js is a client only library. The library and all of its integrations (such as Ultimate UpSet Plot and Ultimate Venn Digramm for PowerBI) don't track you or transfer your data or personal information to any server.
The uploaded data in the app (located at https://upset.js.org/app) are stored in your browser only using IndexedDB. The Tableau extension can run in a sandbox environment prohibiting any server requests.
However, as soon as you export your session within the app (located at https://upset.js.org/app) to an external service (e.g., Codepen.io) your data will be transferred.
License / Terms of Service
Commercial license
If you want to use UpSet.js for a commercial application or in a commercial environment, the commercial license is the appropriate license. Contact @sgratzl for details.
Open-source license
This library is released under the GNU AGPLv3 version to be used for private and academic purposes.
In case of a commercial use, please get in touch regarding a commercial license.

![dependabot[bot]](https://avatars.githubusercontent.com/u/49699333?size=120)