Pingdash 

A simple Web status dashboard for all your services with periodic monitoring commands.
Demo: t.shud.in or azure.shud.in.
Usage
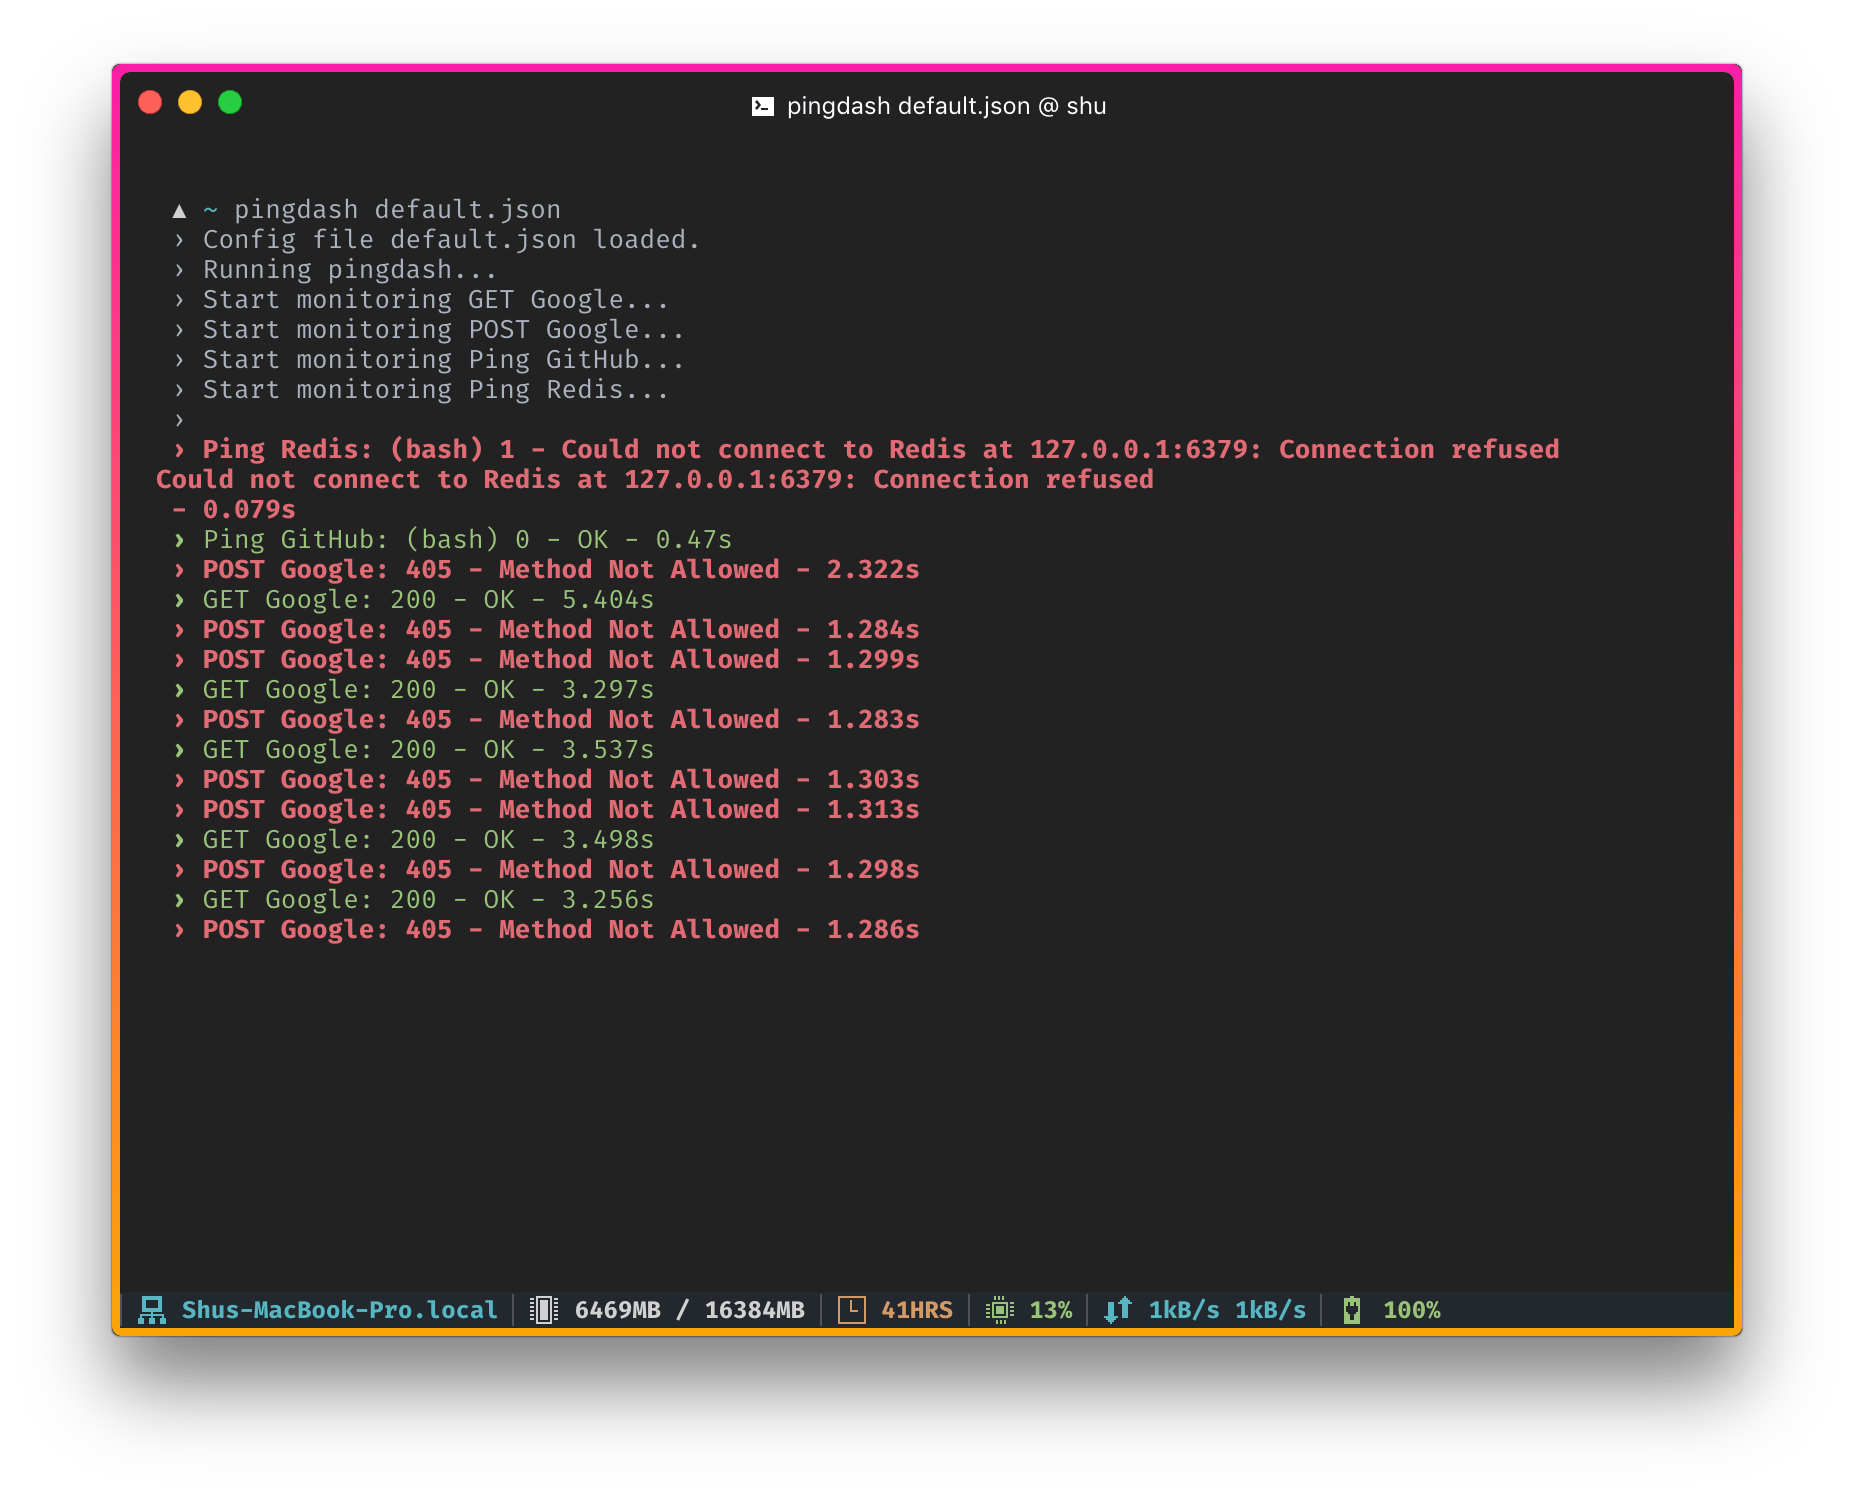
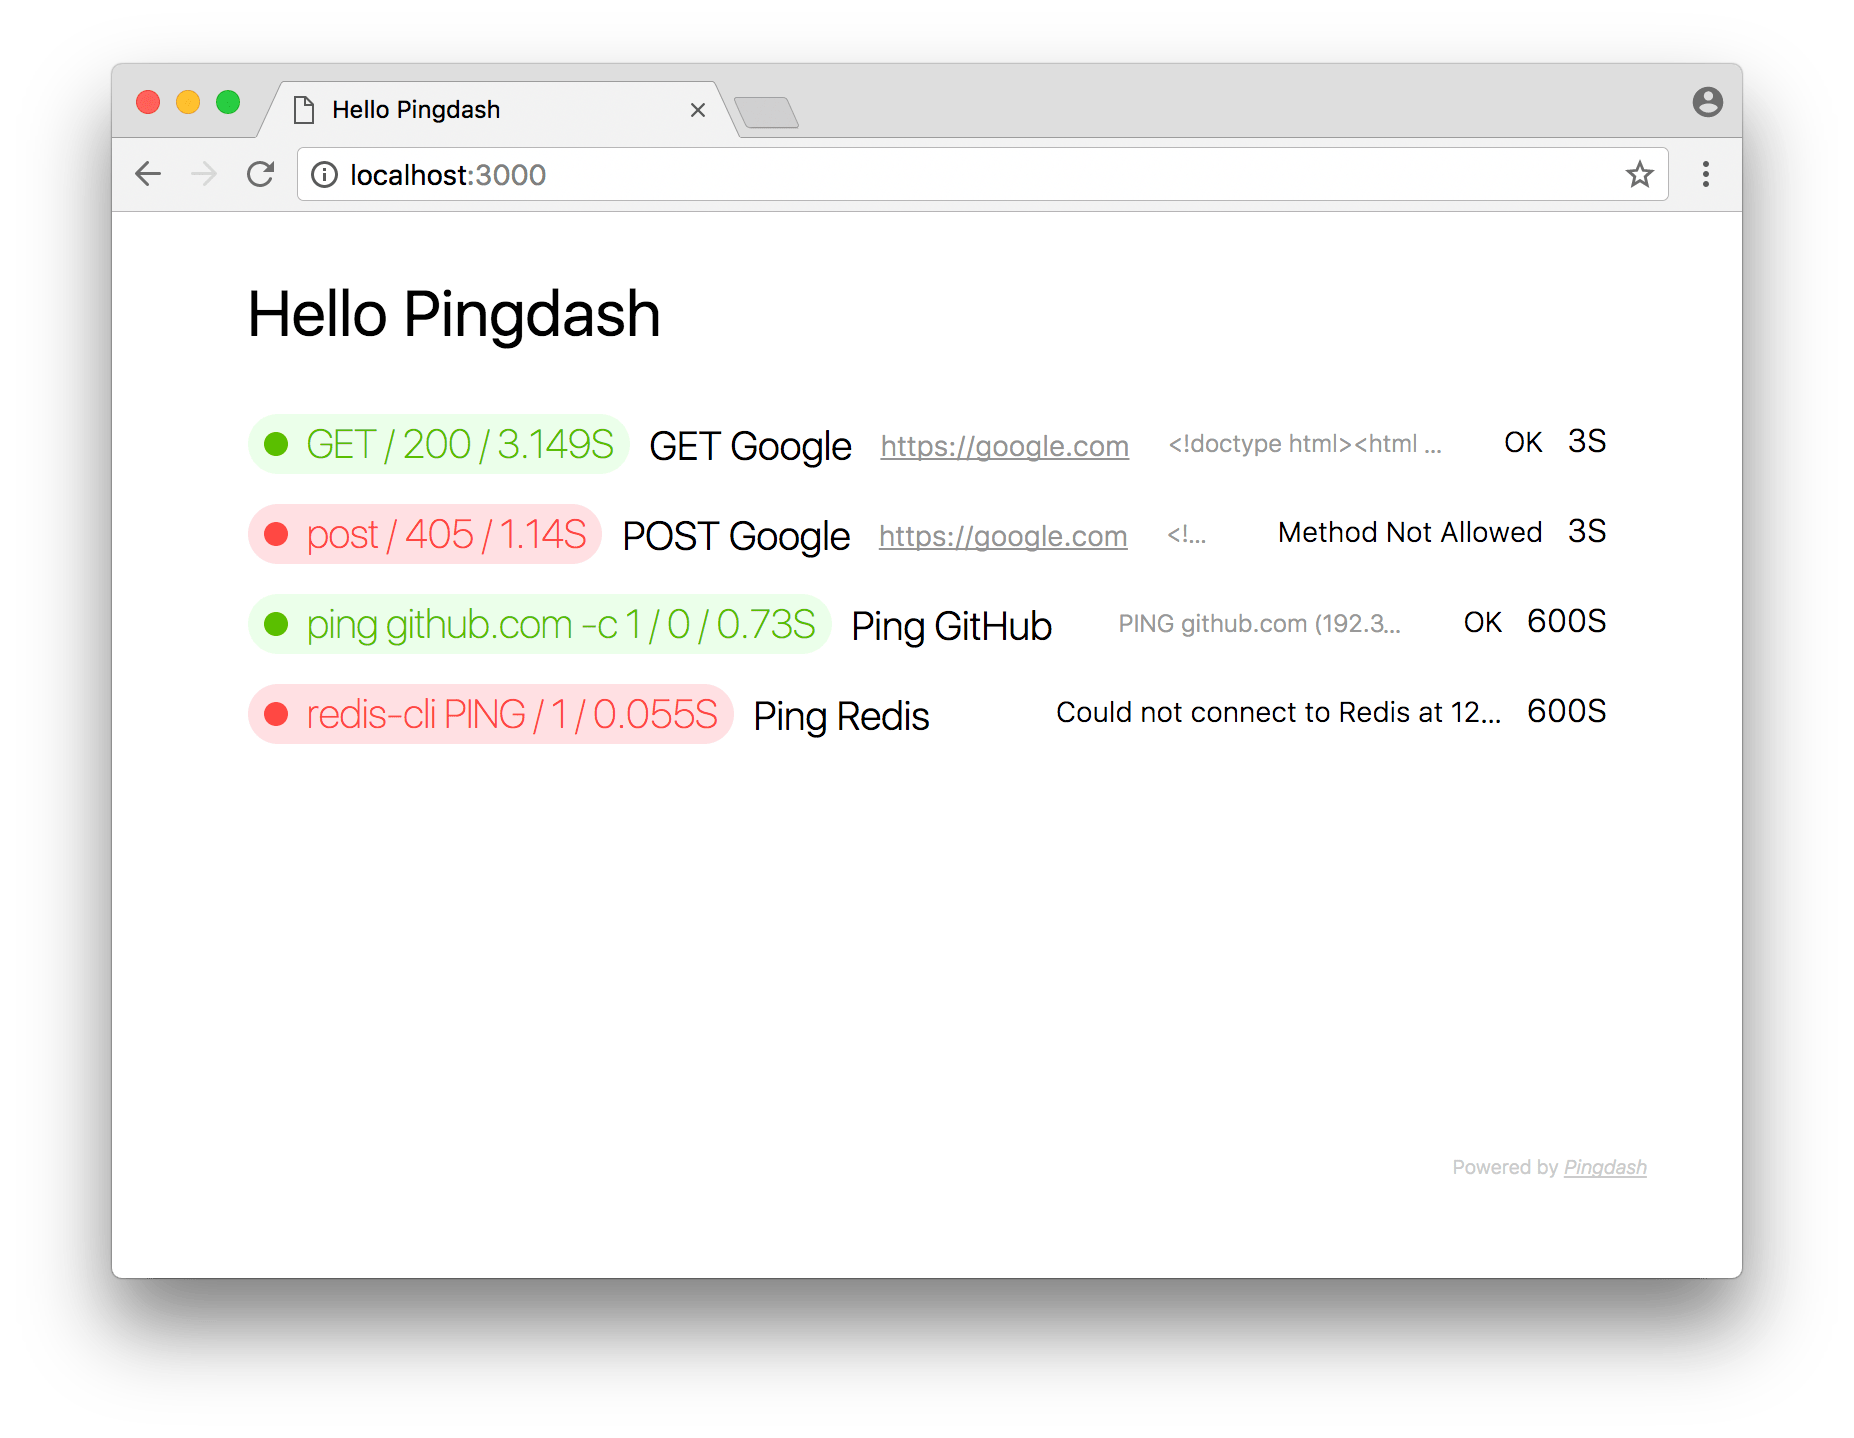
Create a config and run pingdash config.json, a beautiful realtime monitoring page will be instantly setup on http://localhost:3000.
The config file is defined as below:
config.json sample
{
  "title": "Hello Pingdash",
  "port": 3000,
  "data": [
    // send a GET request to Google every 3 seconds
    {
      "name": "Google",
      "url": "https://google.com",       // using GET by default
      "interval": 3
    },
    // ping GitHub once every minute
    {
      "name": "GitHub",
      "method": "ping github.com -c 1",  // CLI commands
      "interval": 60
    },
    // POST request
    {
      "name": "POST Google",
      "method": "post",                  // POST
      "url": "https://google.com",
      "interval": 3
    },
    // ...
  ]
}
Install
You could use npm or yarn to install it globally (recommand node.js version >= 6.0):
npm i pingdash -gOr use yarn:
yarn global add pingdashOptions
$ pingdash --help

  Usage: pingdash [options] <config file>

  Options:

    -h, --help         output usage information
    -V, --version      output the version number
    -p, --port <port>  server's listen port, 3000 default
    -s, --silent       don't output any logs
License
The MIT license.
