
PerfIt!

A light-weight library/framework for code/performance instrumentation in .NET (both .NET 4.52+ and .NET Core)
Core Concepts
- Instrumentation: an aspect-oriented or closure-based wrapping of your code to measure how it performances and capture its context
- SimpleInstrumentor: core class within PerfIt responsible for all instrumentations
- Trace: result of an instrumentation. Contains time taken plus both configuration-based and runtime-based context
- Tracer: A class/system that receives traces and can publish traces to storage/transports (e.g. Console, EventHub, ETW)
- Zipkin: A distributed tracing system/framework/specification developed by Twitter
- Zipkin Emitter: A hub where all Zipkin traces within a process is received
- Zipkin Dispatcher: A class that receives Zipkin traces from the emitter and sends them to a transport/storage
- EventSource: A class in .NET Framework where it raises ETW events under windows and LTTng events in Linux
Breaking changes in version 5.0.0
PerfIt 5 now supports both .NET 4.52+ and .NET Core, and it was an opportunity to get rid of some tech debt and clean up the interfaces. If you have been using previous versions of PerfIt, apart from some minor changes, your code will work as it was. But here are main changes:
-
PublishEventproperty no longer exists. PerfIt always publishes EventSource events although you may remove it from the Tracers dictionary to suppress that. - Everything to do with Performance Counters on
PerfItRuntimehas moved toCounterInstaller. - Instead of
InstrumentationContextstring, now there isInstrumentationContextobject where you can add a bit more context. -
PerfitClientDelegatingHandlerhas moved to PerfIt.Http project/package to support both .NET 4.52+ and .NET Core - There is a
Nameproperty now onIInstrumentationInfo - There is a global static event (
PerfItRuntime.InstrumentorCreated) whenever an Instrumentor is created. Ideal for modifying instrumentors that are created using attributes such as adding/removing tracers.
FAQ
What is PerfIt?
PerfIt is a light-weight and generic instrumentation lib for publishing standard instrumentation traces (Performance Counters and ETW events on Windows, LTTng traces on Linux via .NET Core's EventSource class, Zipkin traces) or your custom ones. Historically, PerfIt woudl only support Performance Counters and ETW, but it publish those if they are supported on the platform it runs.
What are PerfIt packages?
- PerfIt: common constructs for instrumentation
- PerfIt.Http: for instrumenting HttpClient
- PerfIt.WebApi: for instrumenting ASP.NET Web API
- PerfIt.Mvc: for instrumenting ASP.NET MVC
- PerfIt.CoreMvc: for instrumenting ASP.NET Core MVC
- PerfIt.Tracers.EventHub: for publishing PerfIt traces to EventHub
- PerfIt.Zipkin: common constructs for adding Zipkin traces
- PerfIt.Zipkin.EventHub: for publishing Zipkin traces to EventHub
Why do I need PerfIt?
If you are using .NET for a serious project, you would most likely want to instrument your code and network-bound calls. PerfIt helps to make instrumentation easier by looking after boilerplate stuff so that you focus on your business logic.
What is the overhead of using PerfIt?
It is negligible compared to the code you would normally find within an API. It should be <1ms.
What about instrumenting serving or consuming HTTP?
PerfIt has constructs for ASP.NET MVC, ASP.NET Web API, ASP.NET Core MVC and HttpClient.
What counters does it publish?
If your platform supports performance counters (Windows) and you have not disabled it, it will publish counters. There are 5 standard counters that come with PerfIt out of the box (TotalNoOfOperations, AverageTimeTaken, LastOperationExecutionTime, NumberOfOperationsPerSecond and CurrentConcurrentOperationsCount) and you can choose one or all (typically you would choose all).
You can also create your own counters by implementing a simple base class.
What is category and instance name? Is this not a left-over from Performance Counters?
Yes and no. Yes, it was added initially because of Performance Counters but still is a common sense two-level hiararchy for naming traces. So they are here to stay.
What if I just want ETW events and no Performance Counters since installing them is a hassle?
You can turn only ETW or Performance Counters or both (or None).
I am using a library which publishes counters and I have my own counters in my project and I want to turn off library counters but keep mine?
As of version 2.1, you can control counters or raising ETW by their category name in your app.config (or web.config) appSettings. The syntax for category-based configuration is to have keys as "perfit:<feature>:<categoryName>" where feature is one of "publishCounters", "publishErrors" and "publishEvent" and value is boolean. The previous global syntax of "perfit:<feature>" which turns features blanket on or off. [Bear in mind, appSettings overrides values set in code.]
Example:
<add key="perfit:publishCounters" value="true"/>
<add key="perfit:publishErrors:a" value="false"/>
<add key="perfit:samplingRate:dd" value="0.02"/>
In this case, publishCounters is globally on and publishErrors for category a is off. Also sampling rate is set to 2% for category dd.
If you need define these for an Azure application, Azure configuration schema does not allow you to use colon (:) in the name of the configuration. In this case, use pound sign (#) as the delimiter:
<add key="perfit#publishCounters" value="true"/>
<add key="perfit#publishErrors#a" value="false"/>
<add key="perfit#samplingRate#dd" value="0.02"/>
Getting Started (Measuring any part of your code)
Best way to get started is to look at the samples solution and have a look at its README.
But here are two typical scenarios, one for .NET Core (Windows/Mac/Linux) with closure-base instrumentation and other for .NET 4.52 (Windows) with aspect-oriented publishing Performance Counters
Getting Started - .NET Core (Windows/Mac/Linux)
Step 1: Create an Console project
Use Visual Studio or dotnet new to create an empty console application
Step 2: Add PerfIt to your project
Add reference to PerfIt
PM> Install-Package PerfIt
Step 3: Add this code
var si = new SimpleInstrumentor(new InstrumentationInfo()
{
    CategoryName = "test-category",
    InstanceName = "test-instance"
});

si.Tracers.Add("TextFile", new SeparatedFileTracer("trace.txt"));
si.InstrumentAsync(() => Task.Delay(100)).GetAwaiter().GetResult();
Thread.Sleep(100);
si.Dispose();
Console.WriteLine(File.ReadAllText("trace.txt"));
As you can see, traces get stored on the file. This is not an option for very high performance cases but it is OK for cases where sampling is low or the load is not too big and you can use File tailers such as Elatico's Beats/LogStash to tail this trace file.
Getting Started - ASP.NET Web API (Windows)
Step 1: Create an ASP.NET Web API
Use Visual Studio to create an ASP.NET Web API and add a controller (such as DefaultController).
Step 2: Add PerfIt to your project
In the package manager console, type:
PM> Install-Package PerfIt.WebApi
Step 3: Decorate your actions
In the actions you would want to monitor, add this attribute (we are using default counters so no need to specify them):
[PerfItFilter("MyApiCategory", Description = "My cool API"]
public string Get()
{
    ...
}
Step 4: Add an installer class
Right-click on your ASP.NET Web API and choose Add an Item and then from the menu choose "Installer Class".
Once added, click F7 to see the code and then add these lines:
public override void Install(IDictionary stateSaver)
{
 base.Install(stateSaver);
 CounterInstaller.Install(Assembly.GetExecutingAssembly(), new FilterDiscoverer());
}

public override void Uninstall(IDictionary savedState)
{
	base.Uninstall(savedState);
	CounterInstaller.Uninstall(Assembly.GetExecutingAssembly());
}
Step 5: Register your counters using InstallUtil.exe
In the command line, change directory to the .NET framework in use and then use -i switch to install ASP.NET Web API dll:
C:\Windows\Microsoft.NET\Framework64\v4.0.30319>InstallUtil -i "c:\myproject\path\bin\MyAspNetWebApi.dll"
Step 6: Use your API and see the counters being published
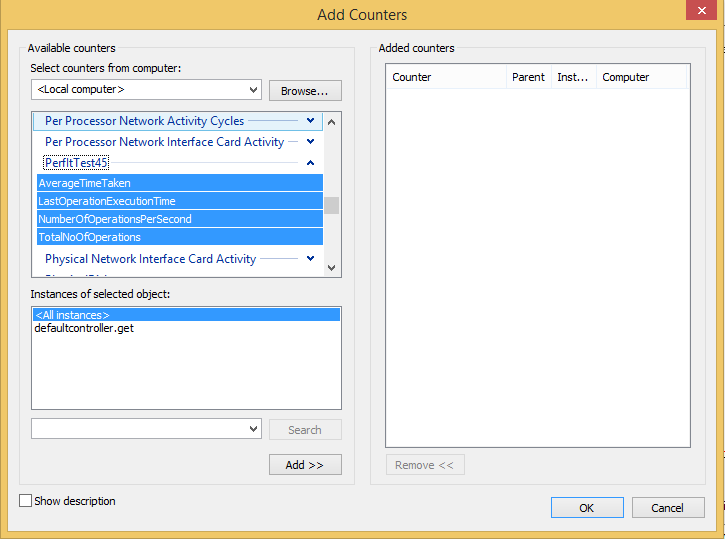
Your counters will be published under a category, with the same name as your project. Underneath, you will see instance(s) of your individual counters.
Common scenarios
Changing default category name
You can do this by supplying your custom category name to all three methods below (make sure they are all the same):
CounterInstaller.Install("MyCategoryName");

// AND

CounterInstaller.Uninstall("MyCategoryName");

// AND

var handler = new PerfItDelegatingHandler("MyCategoryName");
Changing default instance name
By default, instance name is composed of controller name and action name. If you have two actions with the same name (overloading a method), either you need to use ActionName attribute or change the method name (e.g. instead of Get using GetCustomer).
An alternative method is to supply instance name (also useful when you want to supply your custom name):
[PerfItFilter(Description = "Gets all items",
    Counters = ...,
    InstanceName="AnyName")]
public string Get()
{
    ...
}
Turn off publishing counters
For whatever reason you might decide to turn off publishing counters. All you have to do is to add this entry to the AppSetting of your web.config:
  <appSettings>
    ...
    <add key="perfit:publishCounters" value="false"/>
    ...
  </appSettings>
As of version 2.1, there is option to turn on and off by CategoryName - see above.
Not to throw publishing errors
By default, publishing performance counters are regarded as having the same importance as the application's business logic and all publishing errors are thrown. If you would like to change this behaviour, you can do so in config:
  <appSettings>
    ...
    <add key="perfit:publishErrors" value="false"/>
    ...
  </appSettings>
If you need to turn on or off publishErrors, publishCounters or publishEvents by category, please see examples above.
FileNotFoundException when registering the DLL using InstallUtil.exe
A common problem is to encounter FileNotFoundException when registering your counters using InstallUtil. This is more common when your use Web API 2. In any case, this is a problem with InstallUtil not honouring your assembly redirects. To solve the problem (and it is just a workaround), simply copy the assembly redirect directives to InstallUtil.exe.config, run the installation and then remove them.
This has been raised a few times (see the issues, for example #11) but the problem is simply the way InstallUtil works - or rather doesn't.
What I found the best solution is to include a copy of InstallUtil.exe and its custom config (which works for your project by copying content of assemblyBinding section of the web.config) along with your deployables and have a script to install the counter, rather than relying on the standard InstallUtil on the box. These files are small and certainly a good solution.


