badcrossbar is a nodal analysis solver for passive crossbar arrays that suffer from line resistance. It solves for currents in all the branches, as well as for voltages at all the nodes of the crossbar. Additionally, it can create diagrams of crossbar arrays colored according to the values of those currents and voltages (or any other variables).
This package was published in SoftwareX as Original Software Publication under the title "badcrossbar: A Python tool for computing and plotting currents and voltages in passive crossbar arrays". To cite, use the following BibTeX entry:
@article{JoksasMehonic2020,
  author       = {Joksas, Dovydas and Mehonic, Adnan},
  date         = {2020},
  doi          = {10.1016/j.softx.2020.100617},
  journaltitle = {SoftwareX},
  pages        = {100617},
  title        = {\texttt{badcrossbar}: A {Python} tool for computing and plotting currents and voltages in passive crossbar arrays},
  volume       = {12},
}Conventional crossbars have a structure like the one shown in the image below. Resistive two-terminal devices (depicted here as memristors) are connected to word lines on one side and to bit lines on the other. In the diagram, the crossbar devices are depicted in black, the word lines are depicted as horizontal blue lines and the bit lines as vertical blue lines. Orange circles denote the nodes, i.e. the connections between the devices and the word/bit lines. The segments of word and bit lines between neighbouring nodes are often seen as interconnects between neighbouring devices and can themselves be modelled as resistive elements.
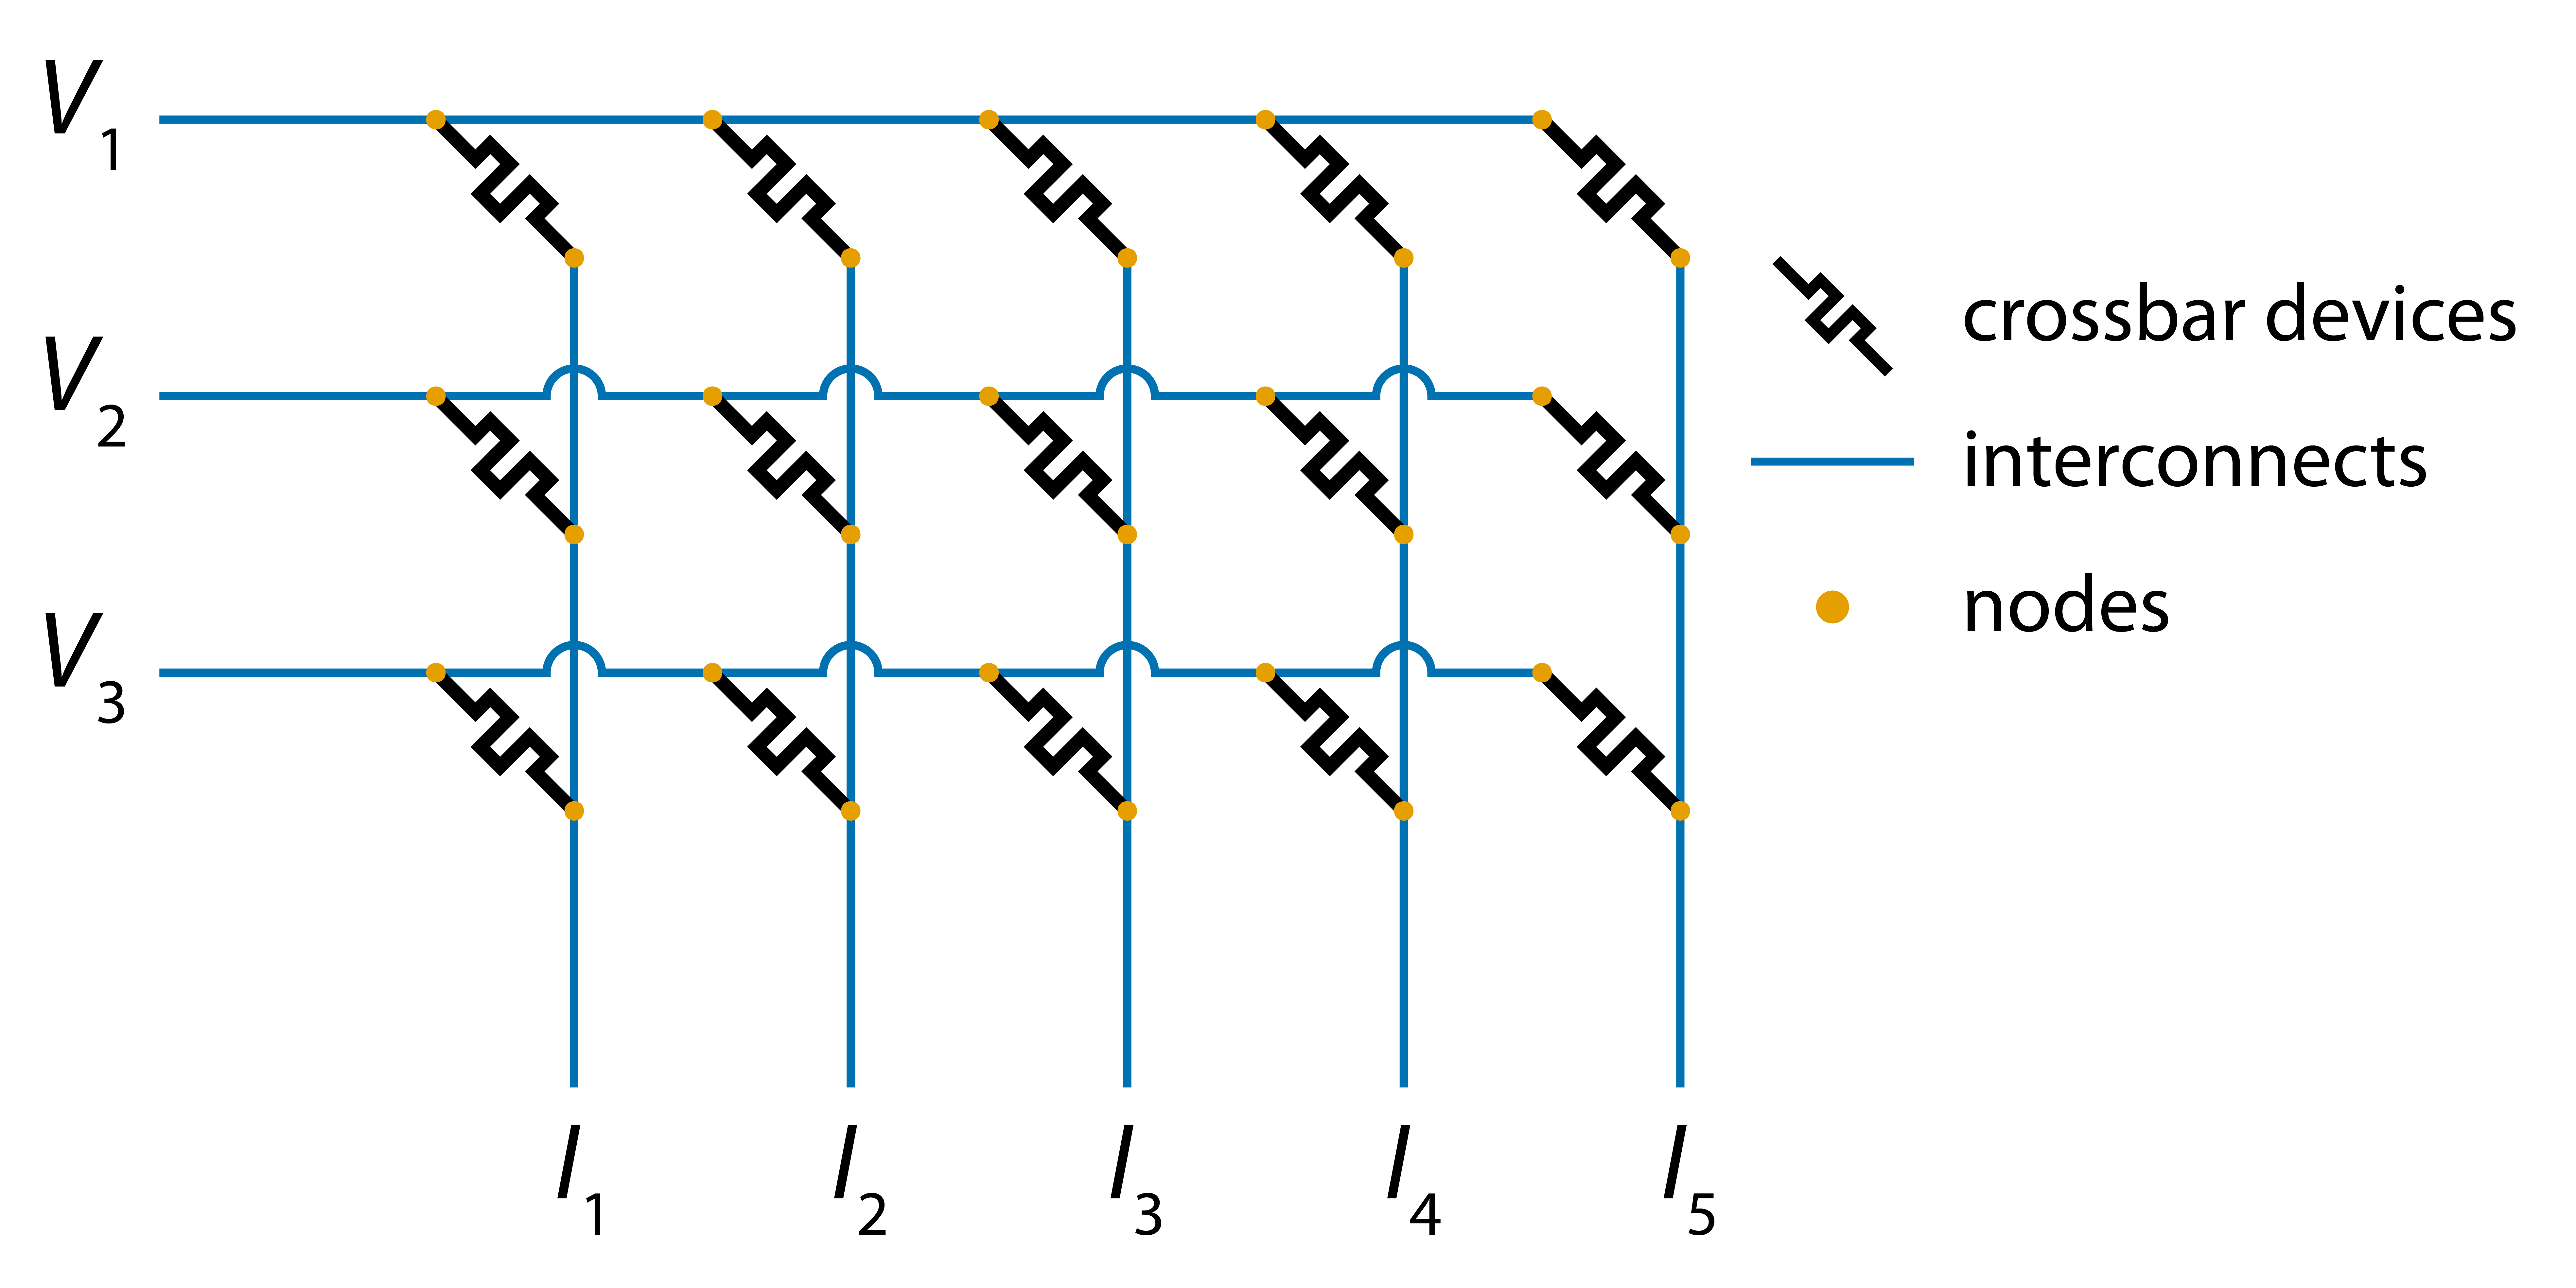
In most practical scenarios, we want the resistance of the interconnects to be zero. That is because crossbar arrays containing resistive elements can be used as dot product engines, i.e. systems able to compute vector-matrix products in hardware. Specifically, crossbar arrays with interconnect resistance of zero are able to compute the vector-matrix products of applied voltages (vector) and conductances of the crossbar devices (matrix). In the diagram above, voltages are applied on the left side of the word lines and the vector-matrix product is computed in a form of currents at the bottom of the bit lines.
pip install badcrossbar
badcrossbar allows to compute branch currents and node voltages for arbitrary values of applied voltages, devices' resistances and interconnect resistances. It assumes that voltages are applied on the left side of the word lines and the outputs (in the bottom of the bit lines) are grounded. One can define either a single resistance value for all interconnects, or two separate values for word and bit line segments using optional parameters r_i_word_line and r_i_bit_line, respectively.
One can compute branch currents and node voltages with the function badcrossbar.compute, as shown in the code below:
import badcrossbar

# Applied voltages in volts.
applied_voltages = [
    [1.5],
    [2.3],
    [1.7],
]

# Device resistances in ohms.
resistances = [
    [345, 903, 755, 257, 646],
    [652, 401, 508, 166, 454],
    [442, 874, 190, 244, 635],
]

# Interconnect resistance in ohms.
r_i = 0.5

# Computing the solution.
solution = badcrossbar.compute(applied_voltages, resistances, r_i)
The returned variable (named solution, in this case) is a named tuple with fields currents and voltages.
solution.currents is itself a named tuple with fields output, device, word_line and bit_line. The first field represents the output currents, while the rest represent the currents flowing through devices, interconnects along the word lines, and interconnects along the bit lines. All of these branches are depicted in the diagram below:
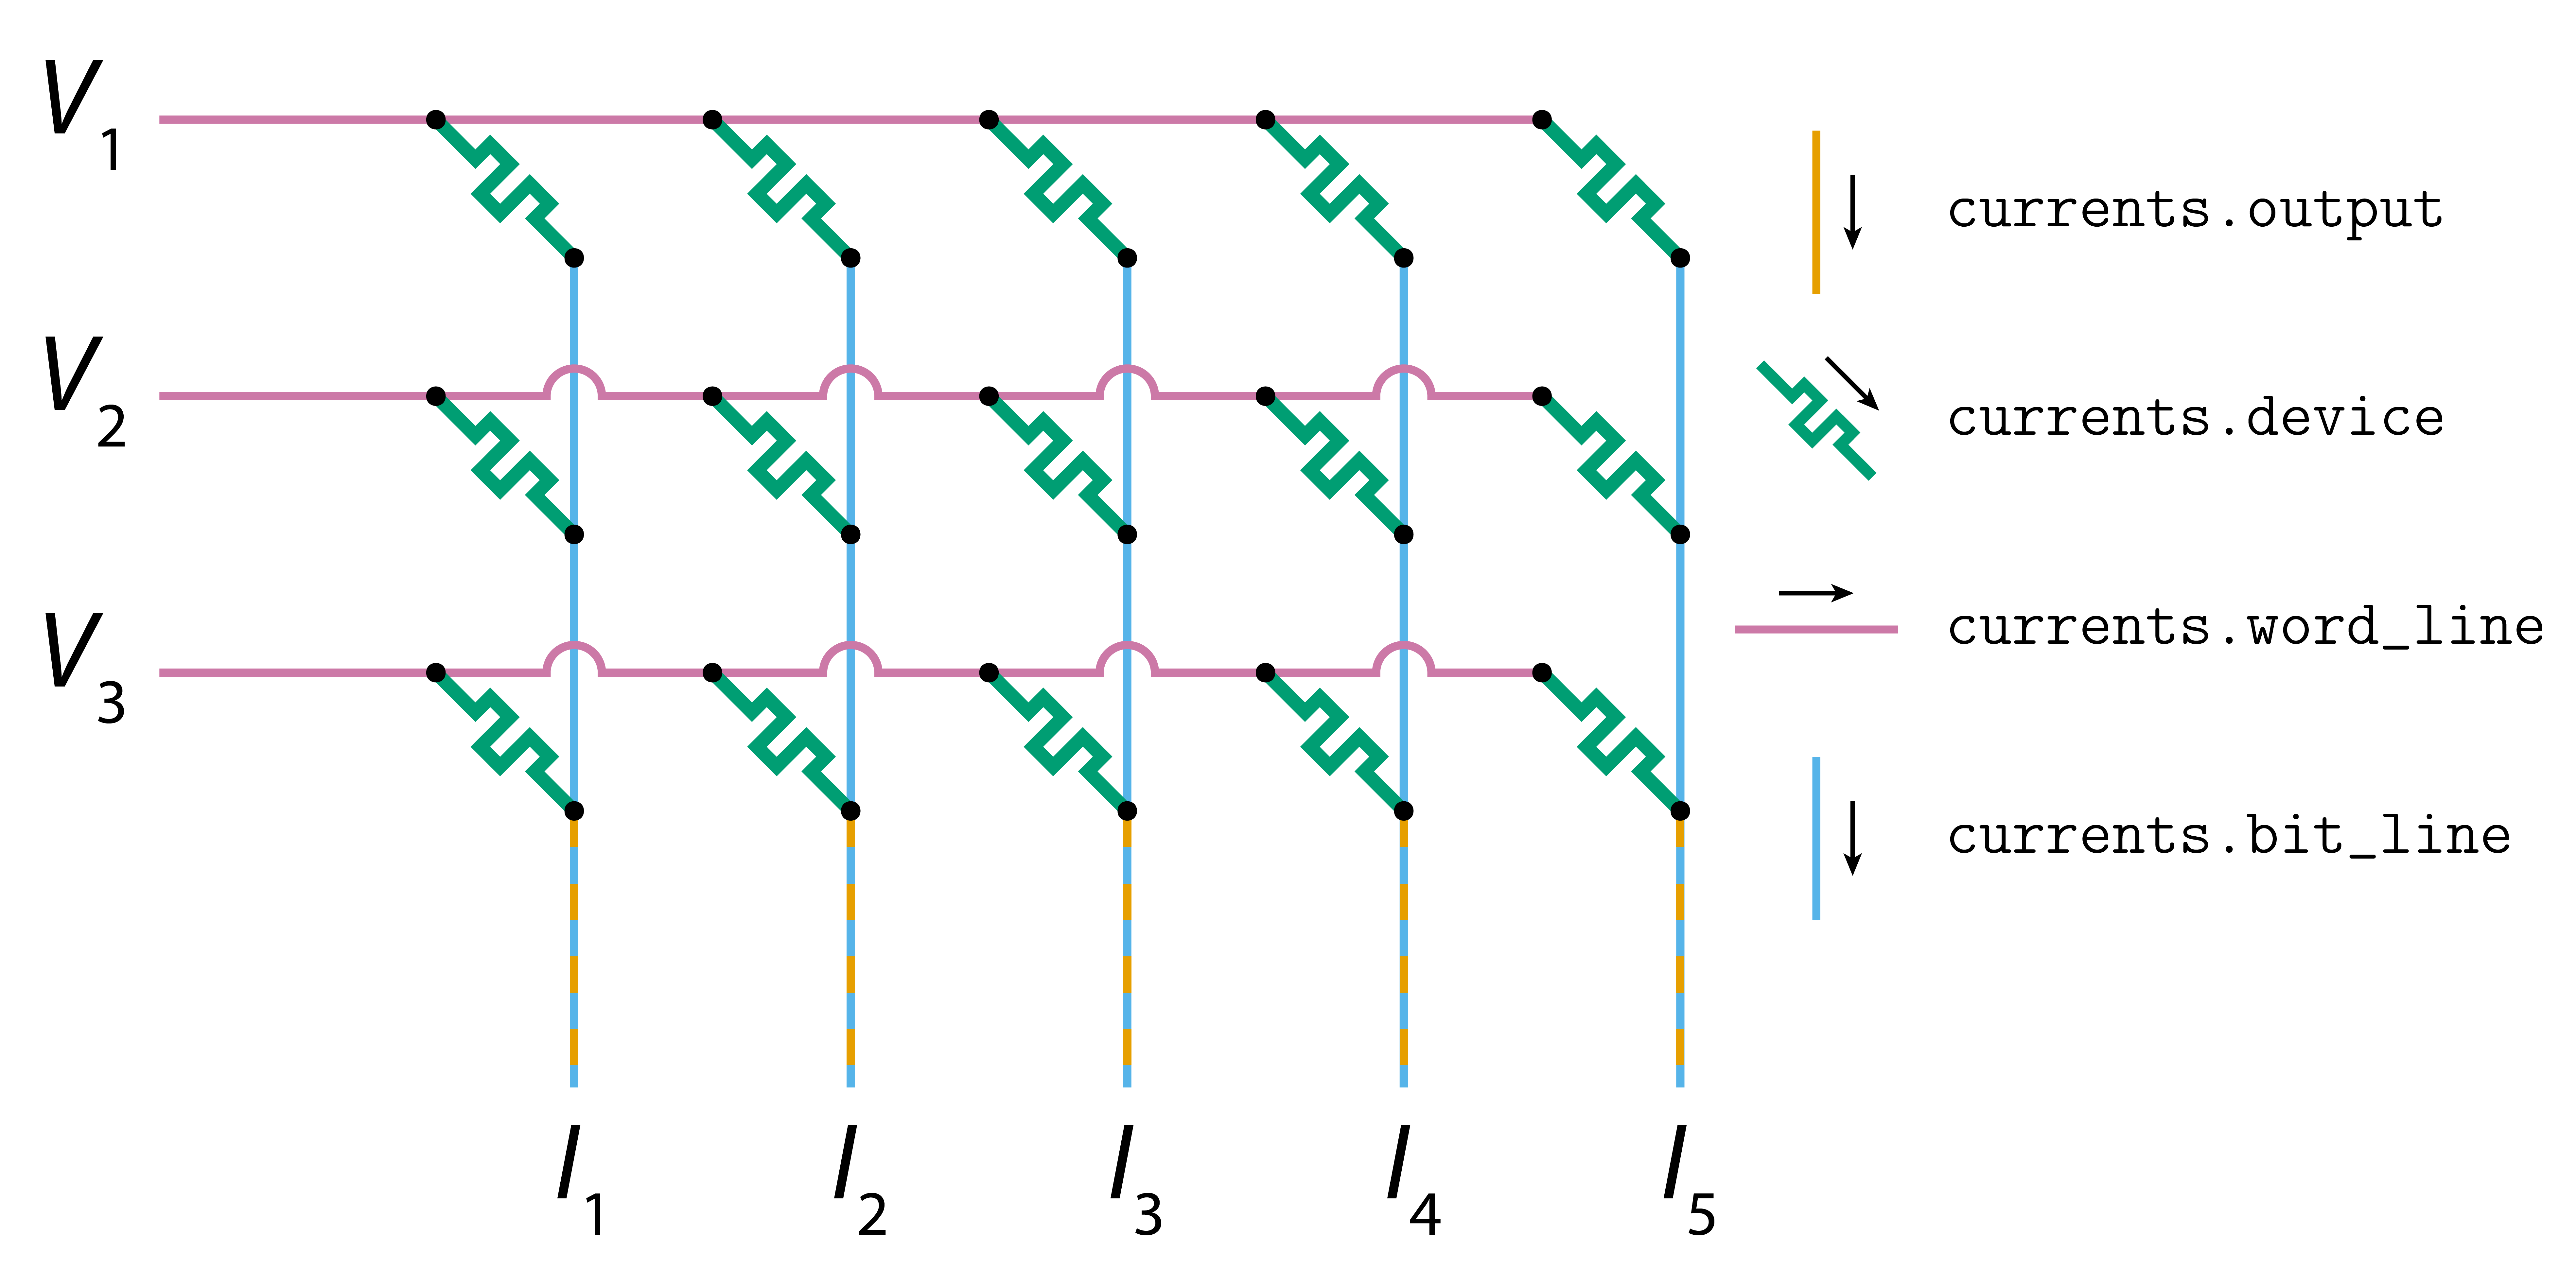
If applied_voltages is an array of shape (m, p) (each column representing a different set of inputs) and resistances is an array of shape (m, n), then:
-
currents.outputwill be a numpy array of shape(p, n). -
currents.device,currents.word_lineandcurrents.bit_linewill be numpy arrays of shape(m, n)ifp = 1, or numpy arrays of shape(m, n, p)ifp > 1.
solution.voltages is itself a named tuple with fields word_line and bit_line. They represent the voltages at the nodes on the word and bit lines, respectively. These two types of nodes are depicted in the diagram below:
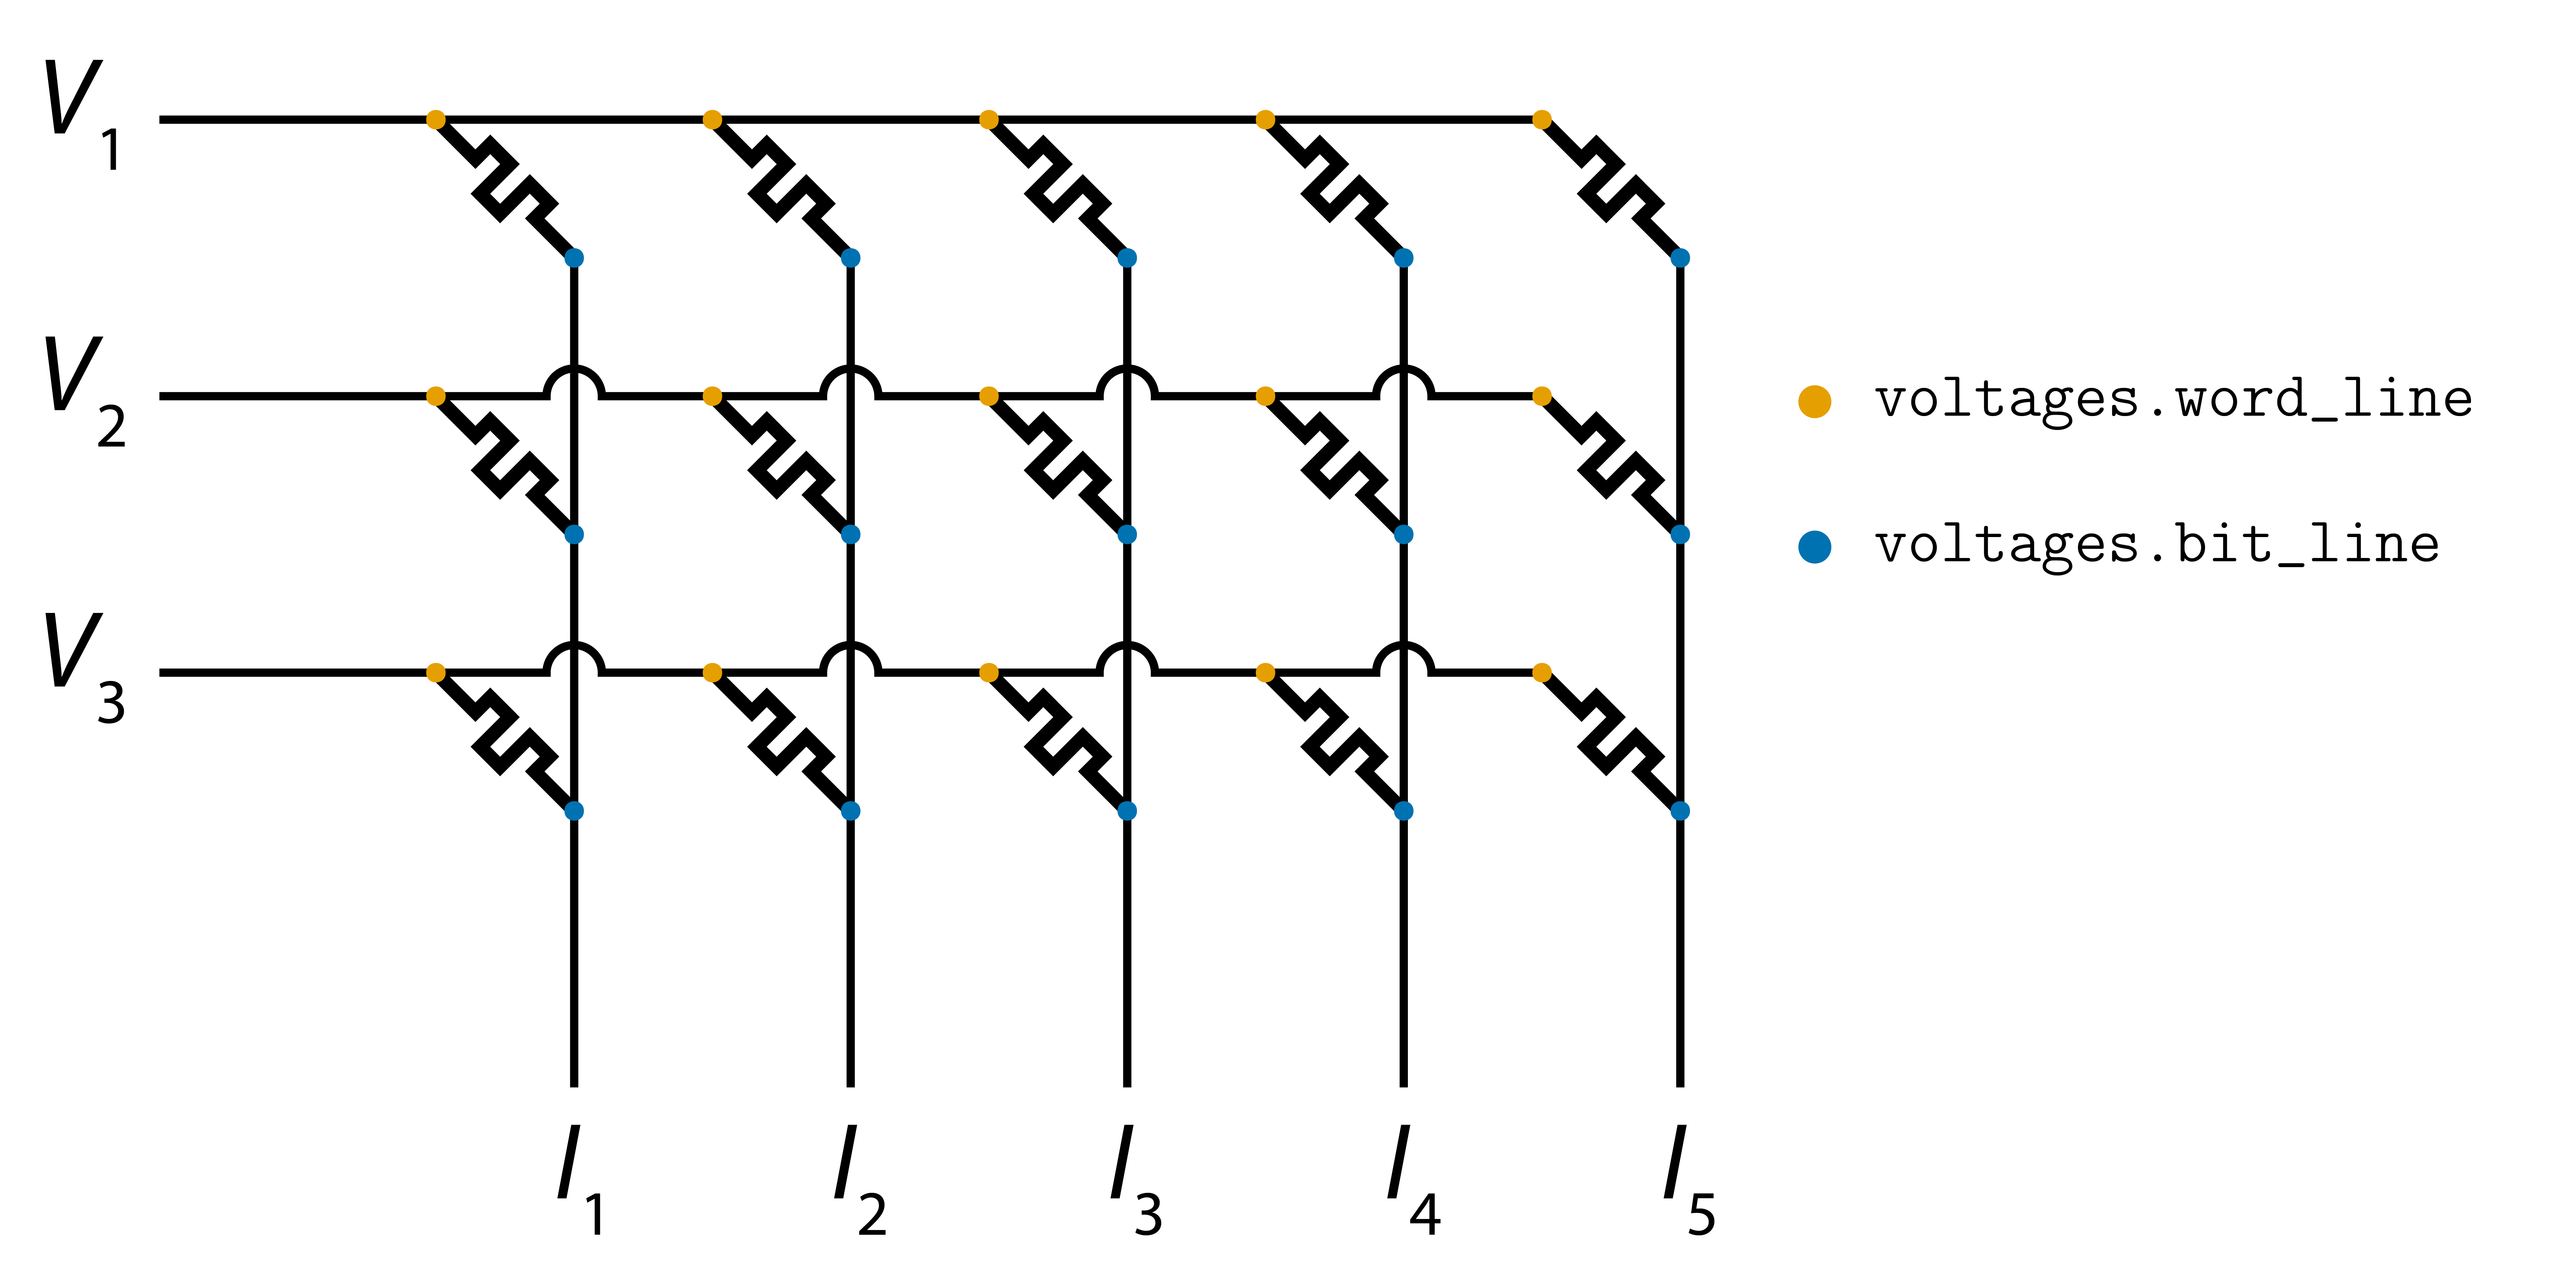
If applied_voltages is an array of shape (m, p) (each column representing a different set of inputs) and resistances is an array of shape (m, n), then voltages.word_line and voltages.bit_line will be numpy arrays of shape (m, n) if p = 1, or numpy arrays of shape (m, n, p) if p > 1.
Suppose we applied four sets of inputs to a crossbar array and wanted to find the current flowing through the device in the first row and fourth column when the third set of inputs was applied. We could print out the current through that device using the following piece of code:
import badcrossbar

# Applied voltages in volts.
applied_voltages = [
    [1.5, 4.1, 2.6, 2.1],
    [2.3, 4.5, 1.1, 0.8],
    [1.7, 4.0, 3.3, 1.1],
]

# Device resistances in ohms.
resistances = [
    [345, 903, 755, 257, 646],
    [652, 401, 508, 166, 454],
    [442, 874, 190, 244, 635],
]

# Interconnect resistance in ohms.
r_i = 0.5

# Computing the solution.
solution = badcrossbar.compute(applied_voltages, resistances, r_i)

# Current that we are interested in (note zero-based indexing).
current = solution.currents.device[0, 3, 2]

print(f"\nCurrent through the device in question is ~{current:.3g} A.")2021-11-20 09:47:52 (INFO): Initialising simulation.
2021-11-20 09:47:52 (INFO): Started solving for v.
2021-11-20 09:47:52 (INFO): Solved for v.
2021-11-20 09:47:52 (INFO): Extracted node voltages.
2021-11-20 09:47:52 (INFO): Extracted currents from all branches in the crossbar.
Current through the device in question is ~0.00986 A.
More examples can be found in files 1_single_set_of_inputs.py and 2_multiple_sets_of_inputs.py.
Devices with infinite resistance can be denoted using resistance value of numpy.inf (or equivalently math.inf).
badcrossbar provides badcrossbar.plot module which allows to color crossbar branches and nodes. This is done by functions badcrossbar.plot.branches and badcrossbar.plot.nodes, respectively. Although their primary purpose is for plotting currents and voltages, these functions accept arbitrary arrays and color the branches and nodes, according to the values of these arrays. This functionality is explained in more detail in example 3_different_variables.py.
The function badcrossbar.plot.branches accepts either individual arrays for crossbar devices, word line branches and bit line branches, or a named tuple containing all currents. If any of the arrays are 3D, they are averaged along the third axis.
The following piece of code computes and plots average branch currents over four sets of applied inputs:
import badcrossbar
# Applied voltages in volts.
applied_voltages = [
[1.5, 4.1, 2.6, 2.1],
[2.3, 4.5, 1.1, 0.8],
[1.7, 4.0, 3.3, 1.1],
]
# Device resistances in ohms.
resistances = [
[345, 903, 755, 257, 646],
[652, 401, 508, 166, 454],
[442, 874, 190, 244, 635],
]
# Interconnect resistance in ohms.
r_i = 0.5
# Computing the solution.
solution = badcrossbar.compute(applied_voltages, resistances, r_i)
# Plotting average branch currents over all four sets of inputs.
# We additionally set a custom filename and label of the color bar.
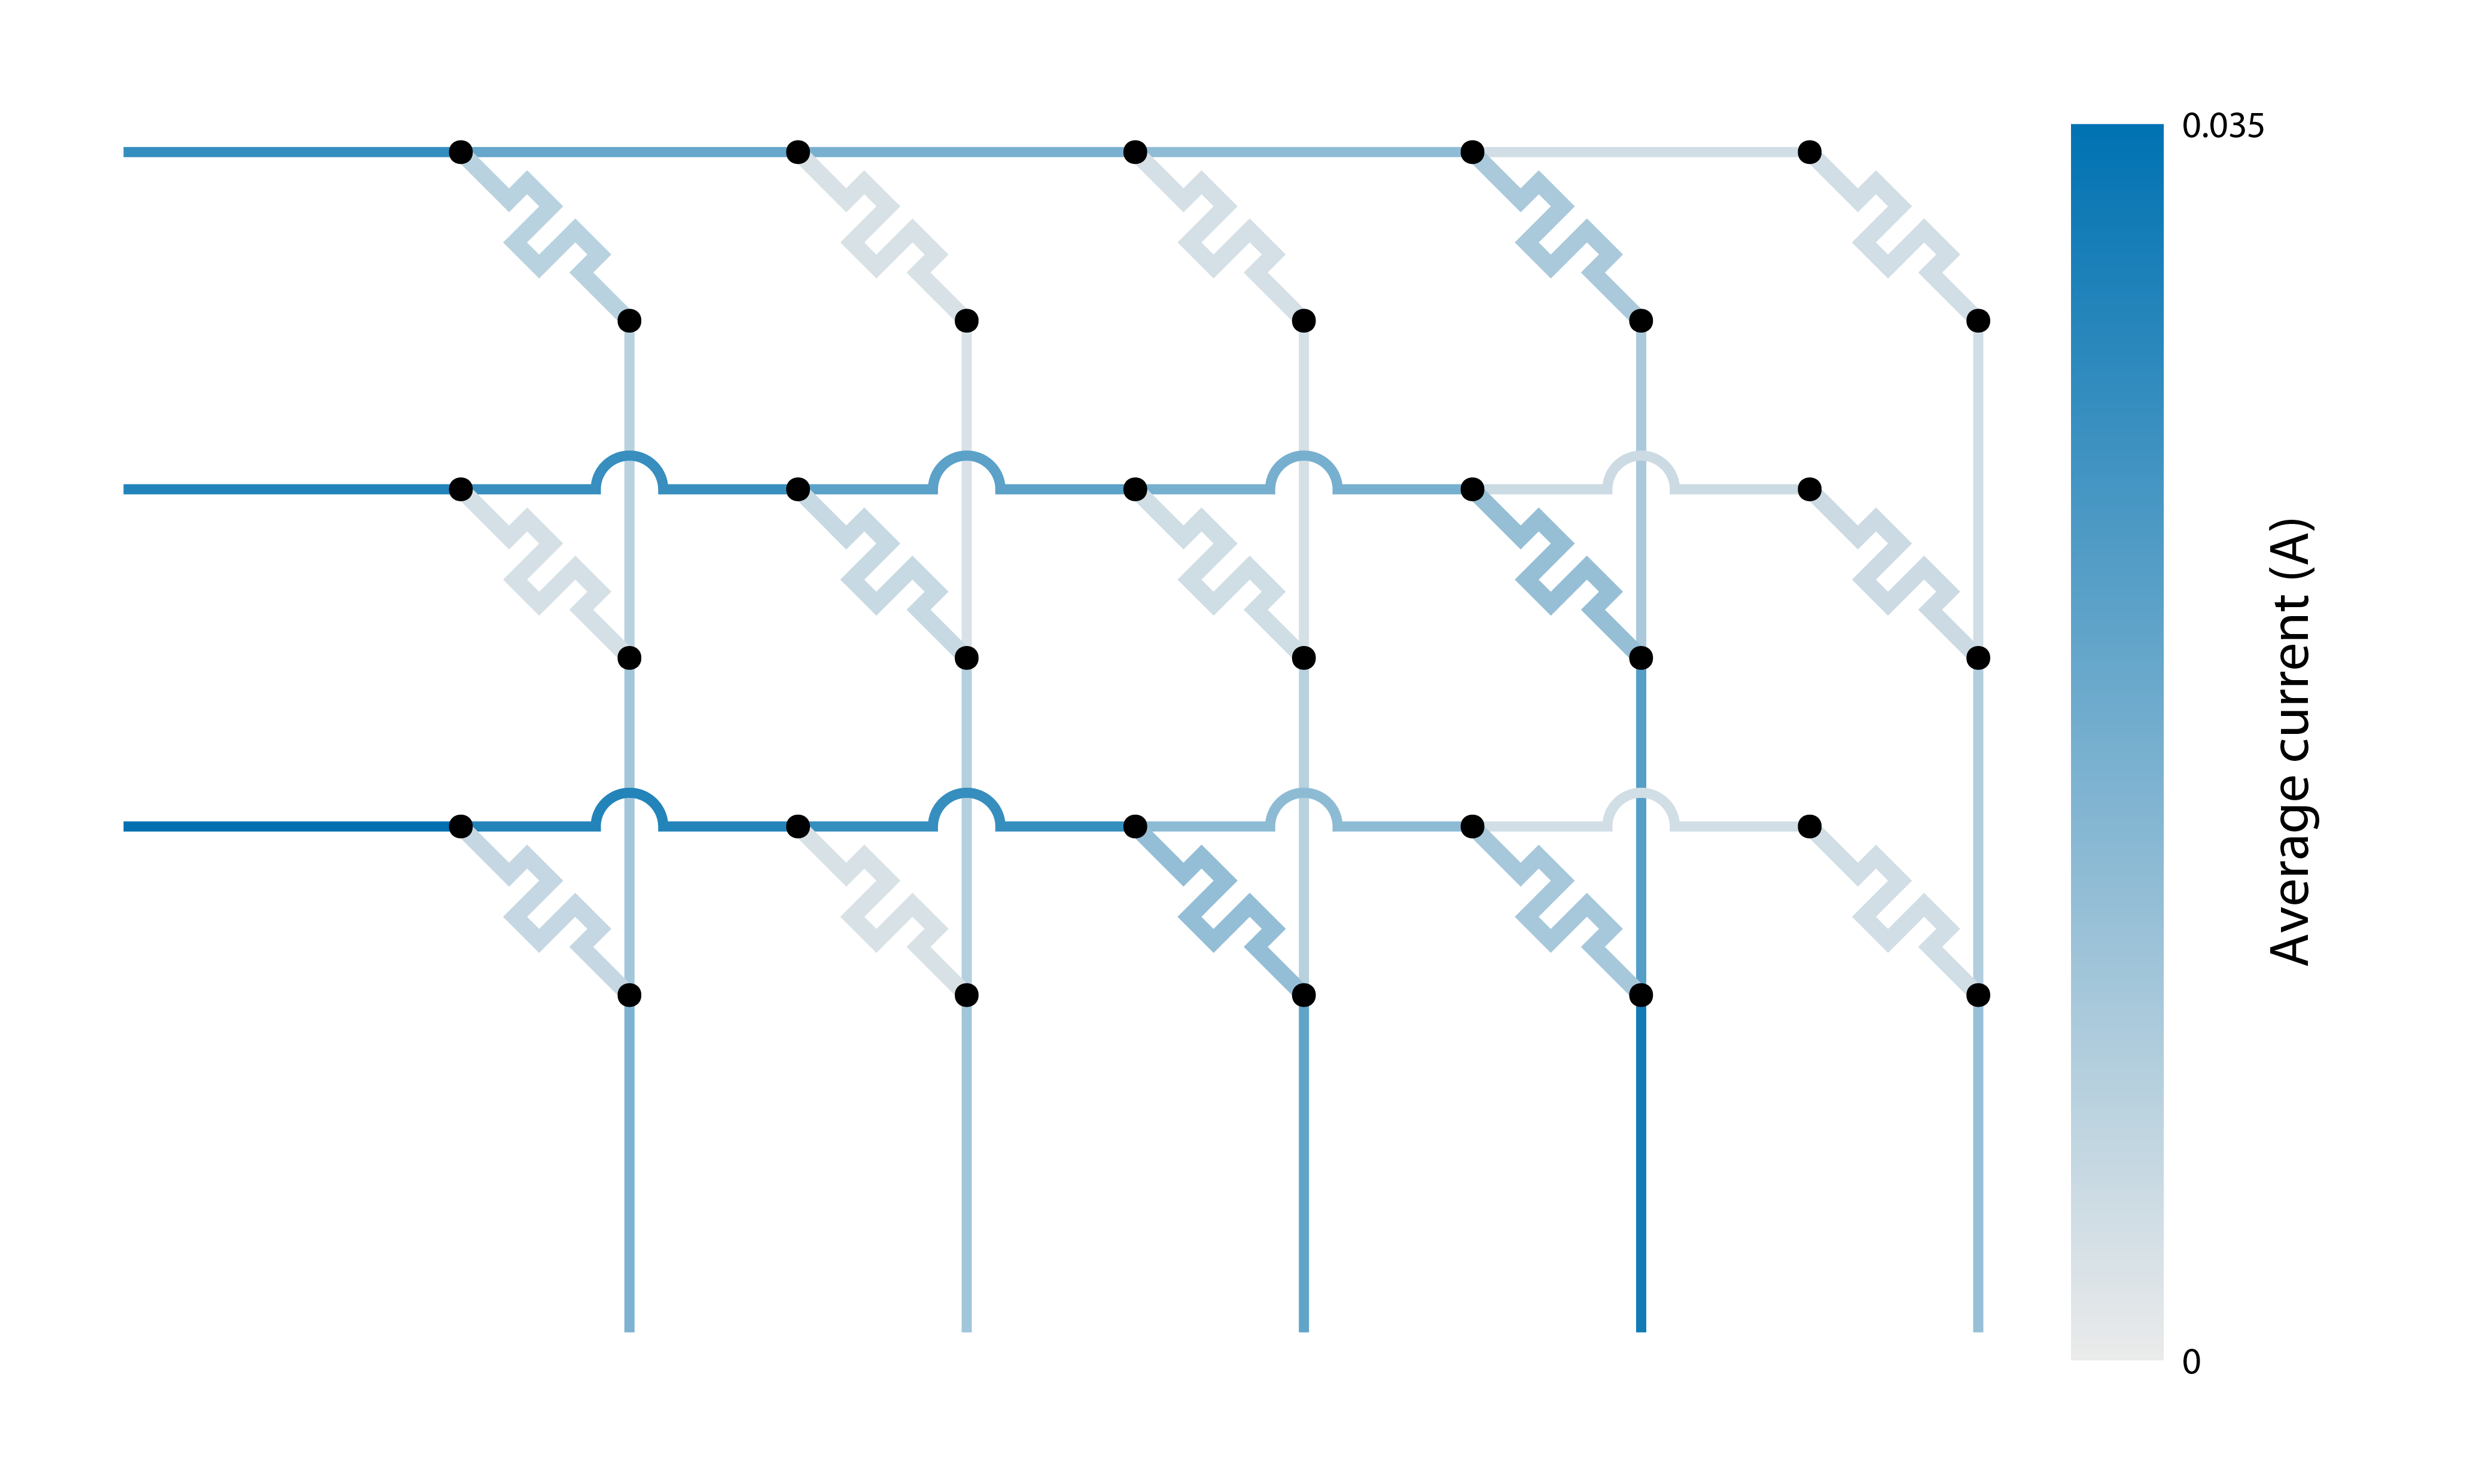
badcrossbar.plot.branches(
currents=solution.currents, filename="average-currents", axis_label="Average current (A)"
)The produced PDF file should contain a diagram similar to the one shown below:
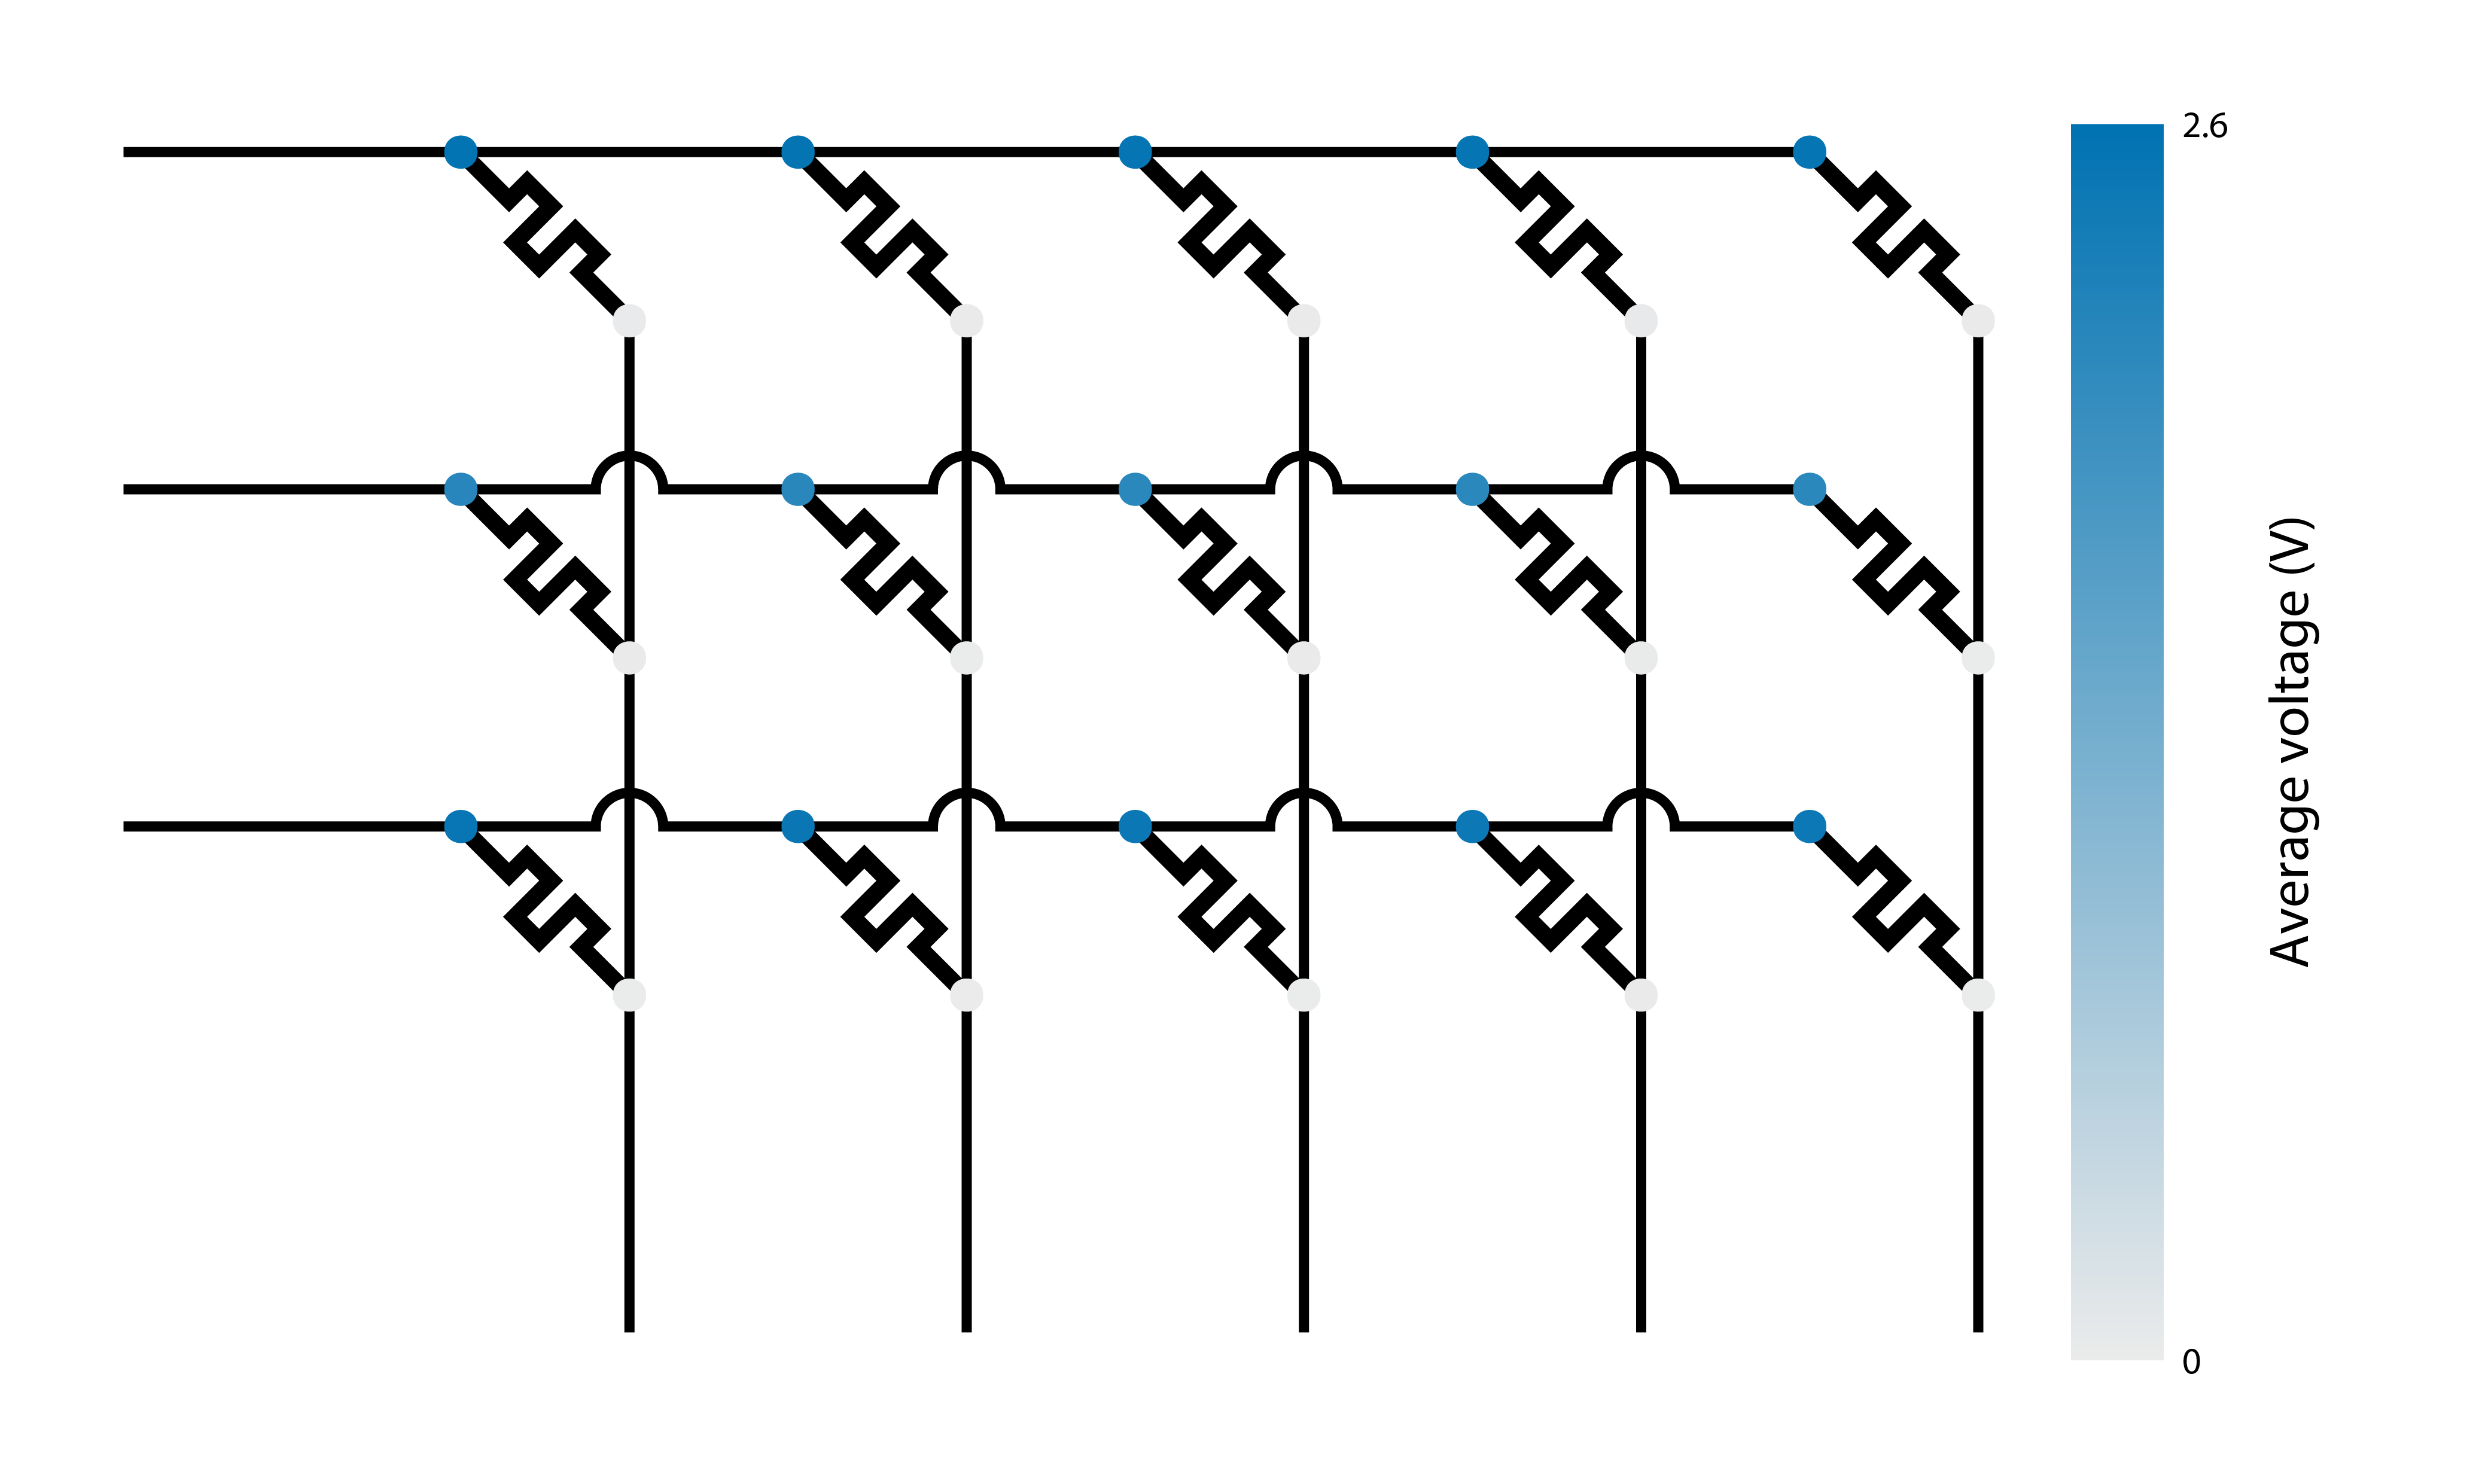
Similarly, badcrossbar.plot.nodes accepts either individual arrays for nodes on the word and bit lines, or a named tuple containing both sets of voltages. If any of the arrays are 3D, they are averaged along the third axis.
The following piece of code computes and plots average node voltages over four sets of applied inputs:
import badcrossbar

# Applied voltages in volts.
applied_voltages = [
    [1.5, 4.1, 2.6, 2.1],
    [2.3, 4.5, 1.1, 0.8],
    [1.7, 4.0, 3.3, 1.1],
]

# Device resistances in ohms.
resistances = [
    [345, 903, 755, 257, 646],
    [652, 401, 508, 166, 454],
    [442, 874, 190, 244, 635],
]

# Interconnect resistance in ohms.
r_i = 0.5

# Computing the solution.
solution = badcrossbar.compute(applied_voltages, resistances, r_i)

# Plotting average node voltages over all four sets of inputs.
badcrossbar.plot.nodes(
    voltages=solution.voltages, axis_label="Average voltage (V)", filename="average-voltages"
)
The produced PDF file should contain a diagram similar to the one shown below. Because the crossbar array, in this case, is small and the interconnect resistance is small relative to the resistance of the devices, we do not see much variation between voltages of nodes of the same type. Differences become more apparent with larger crossbar arrays, as explored in 2_custom_parameters.py, for example.
Examples of how to plot currents or voltages of only certain parts of the crossbar, or how to take into account only part of the sets of applied voltages can be found in 1_default_parameters.py.
Plotting sub-package produces vector images (as PDF files) that can then be edited in any vector graphics manipulation program. However, it also provides option to modify some of the features of the diagram that might be difficult to change once the image is produced. Example 2_custom_parameters.py explores some of these options, while the complete list of modifiable parameters can be found in function docstrings of badcrossbar.plot module.
