This plugin implements a profiler for buildbot master.
- It uses statistical profiling loosely based on plop https://github.com/bdarnell/plop
- Suitable for prod as statistical profiling is very low overhead
- Profiles all threads including main thread and db threads
- Removes noise samples when the threads are actually in the main loop
- In-browser UI based on nvd3 and d3-flame-graph
- Show cpu and memory percent over time
- flame graph can be restricted to a subset of the trace
- Detailed caller/callee are displayed when clicking on a function
Usage
installation:
pip install buildbot_profilerthen in master.cfg:
c['www']['plugins']['profiler'] = TrueAlternatively, you can install it in service mode, without the UI
c['services'] = [util.ProfilerService()]ProfilerService takes following arguments:
ProfilerService(frequency=100, gatherperiod=30 * 60, mode='virtual', basepath=None, wantBuilds=100)-
frequency: the profiling frequency in HZ. Not that if there is no activity during a profiling timer, no data will be recorded. -
gatherperiod: the period during which the profiler works on one file. By default a new json file is created every 30min with the profile of the last 30min. Note that if there is no activity the gather period might be longer. -
mode: profiling timer to use. Can be:-
prof: useSIG_PROFtimer, -
virtual: useSIGVTALRMtimer, -
real: useSIGALRMtimer,
-
-
basepath: the base path where to store the json files. (defaults to(master's basedir)/prof_) -
wantBuilds: if this is > 0 then the last N builds are stored along side the profile data, for debug purpose.
Standalone Viewer
A standalone viewer is provided for offline browse of user submitted profiles.
bbprofilerThen you can open your browser on http://localhost:8080
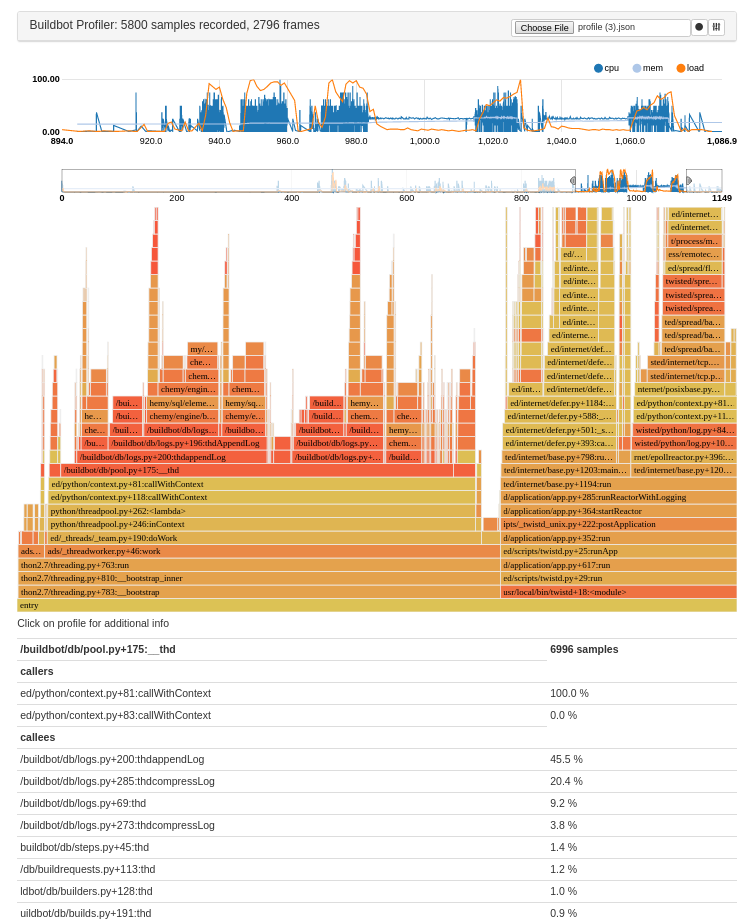
Screenshot
ChangeLog
- 1.3.1 Upgrade build to webpack, Fix argument parsing for record duration and sample rate
- 1.2.3 Fixes for python2
- 1.2.2 Fixes for python3
- 1.2.1 Fix issues with load calculation
-
- 1.2.0 Fold the flames so that you can explore larger traces.
- Fix the service so that the trace is reset between run.
- 1.1.0 add a service to use the profiler without bother the users with a profiler UI.
- 1.0.0 initial version
