GiMPy 2.1
Graph Methods in Python (GiMPy) is a Python graph library containing pure Python implementations of a variety of graph algorithms. The goal is clarity in implementation rather than eficiency. Most methods have an accompanying visualization and are thus appropriate for use in the classroom.
Documentation for the API is here:
https://coin-or.github.io/GiMPy
Pypi download page is here:
https://pypi.python.org/pypi/coinor.gimpy
Installation Notes
To install, do
pip install coinor.gimpy
In order for GiMPy to visualize the graphs it produces, it's necessary to install
GraphViz (Important: after installing
graphviz, you must add the graphviz bin directory, usually
C:\Program Files (x86)\Graphviz2.38\bin, to your PATH)
and choose one of these additional methods for display:
- Recommended: matplotlib and call `set_display_mode('matplotlib')
-
Python Imaging Library and
call
set_display_mode('PIL') - Call
set_display_mode('file')to just write files to disk that have to then be opened manually.
It is also possible to typeset labels in LaTex and to output the graph in
LaTex format using dot2tex. After installing dot2tex, this can be done
by simply calling the method write(basename='fileName', format='dot'), and
then doing dot2tex --tmath fileName.dot or by calling
set_display_mode('dot2tex') and then display() as usual. At the moment,
the latter only seems to work with version 2.9.0dev available
here. For the former method, just
using easy_install dot2tex should work fine.
Additional Notes for Windows Installation
- To install Graphviz, download the installer here. Important: after installing, you must manually add the graphviz
bindirectory (usuallyC:\Program Files (x86)\Graphviz2.38\bin) to yourPATH - If you want to use
xdot, there are some more requirements:- Unfortunately, you must have a 32-bit version of Python 2.7
- You must install the PyGtk version 2.22.6. Version 2.24 is buggy on Windows.
- To install
gnuplot, download the installer here. Note that the CYGWIN version of gnuplot may not work when called from Python.
Additional Notes for Linux Installation
- Graphviz can be installed as a package on most Linux distros, e.g.,
sudo apt-get install graphviz
Additional Notes for OS X Users
- The situation with Python on OS X is a bit of a mess. It is recommended to install python using homebrew with
brew install python). - With homebbrew, one can also easily install graphviz (
brew install graphviz).
Examples
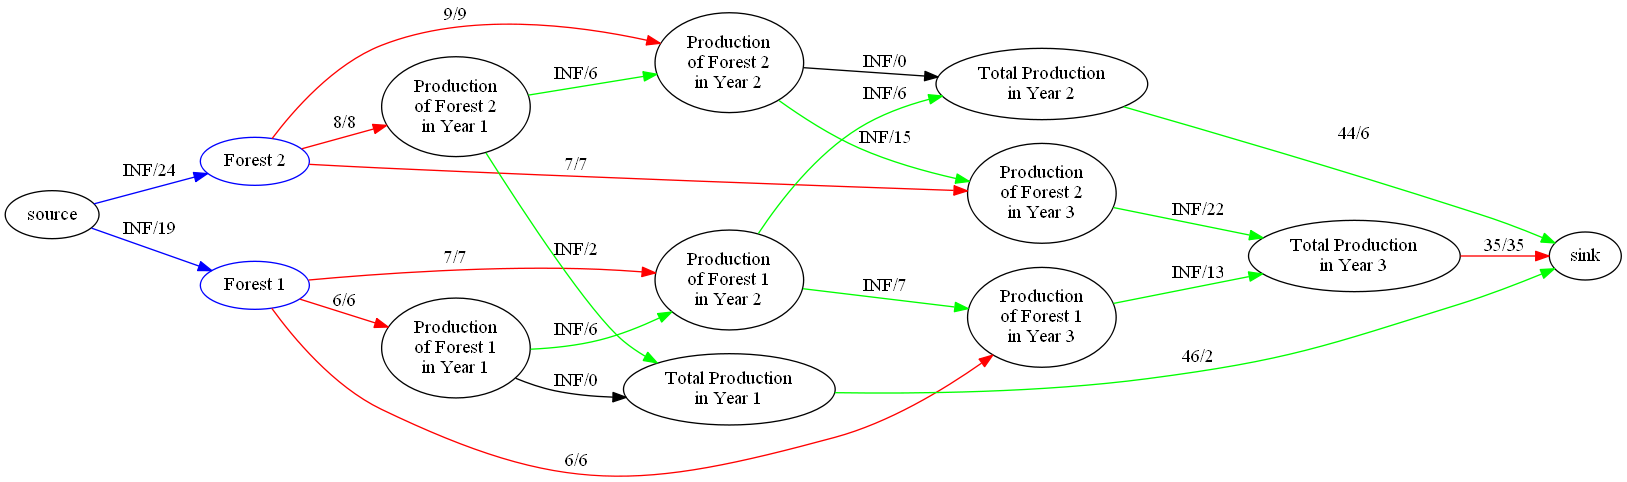
Forestry Model
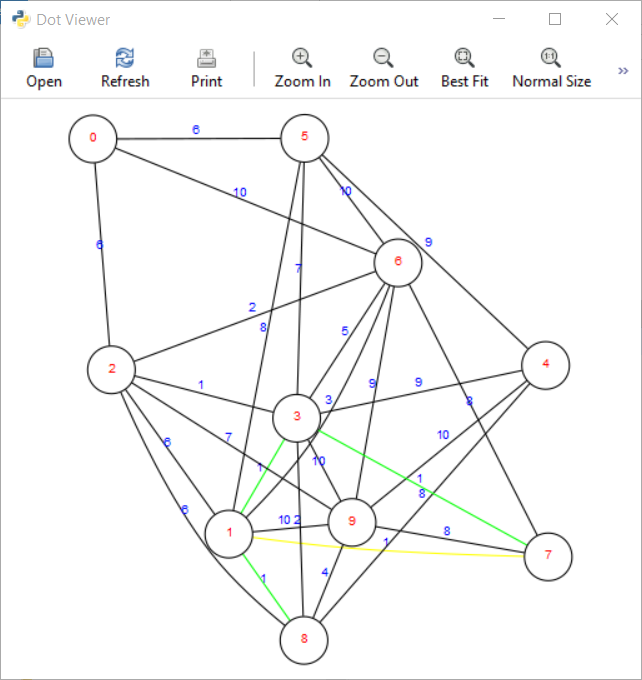
Display Window in XDot
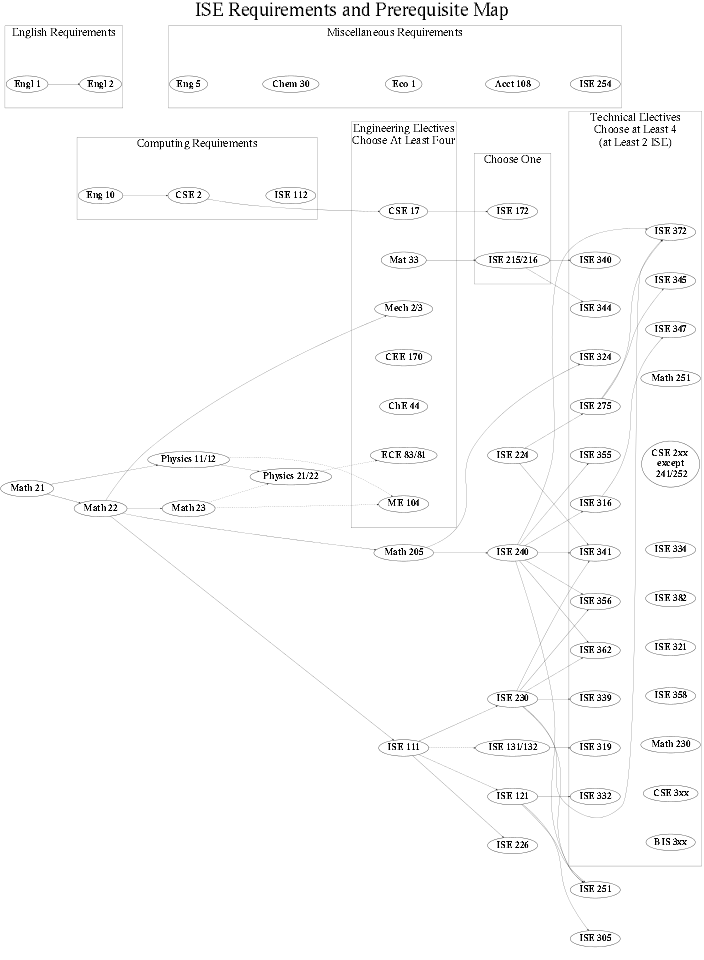
Lehigh ISE Prerequisite Graph
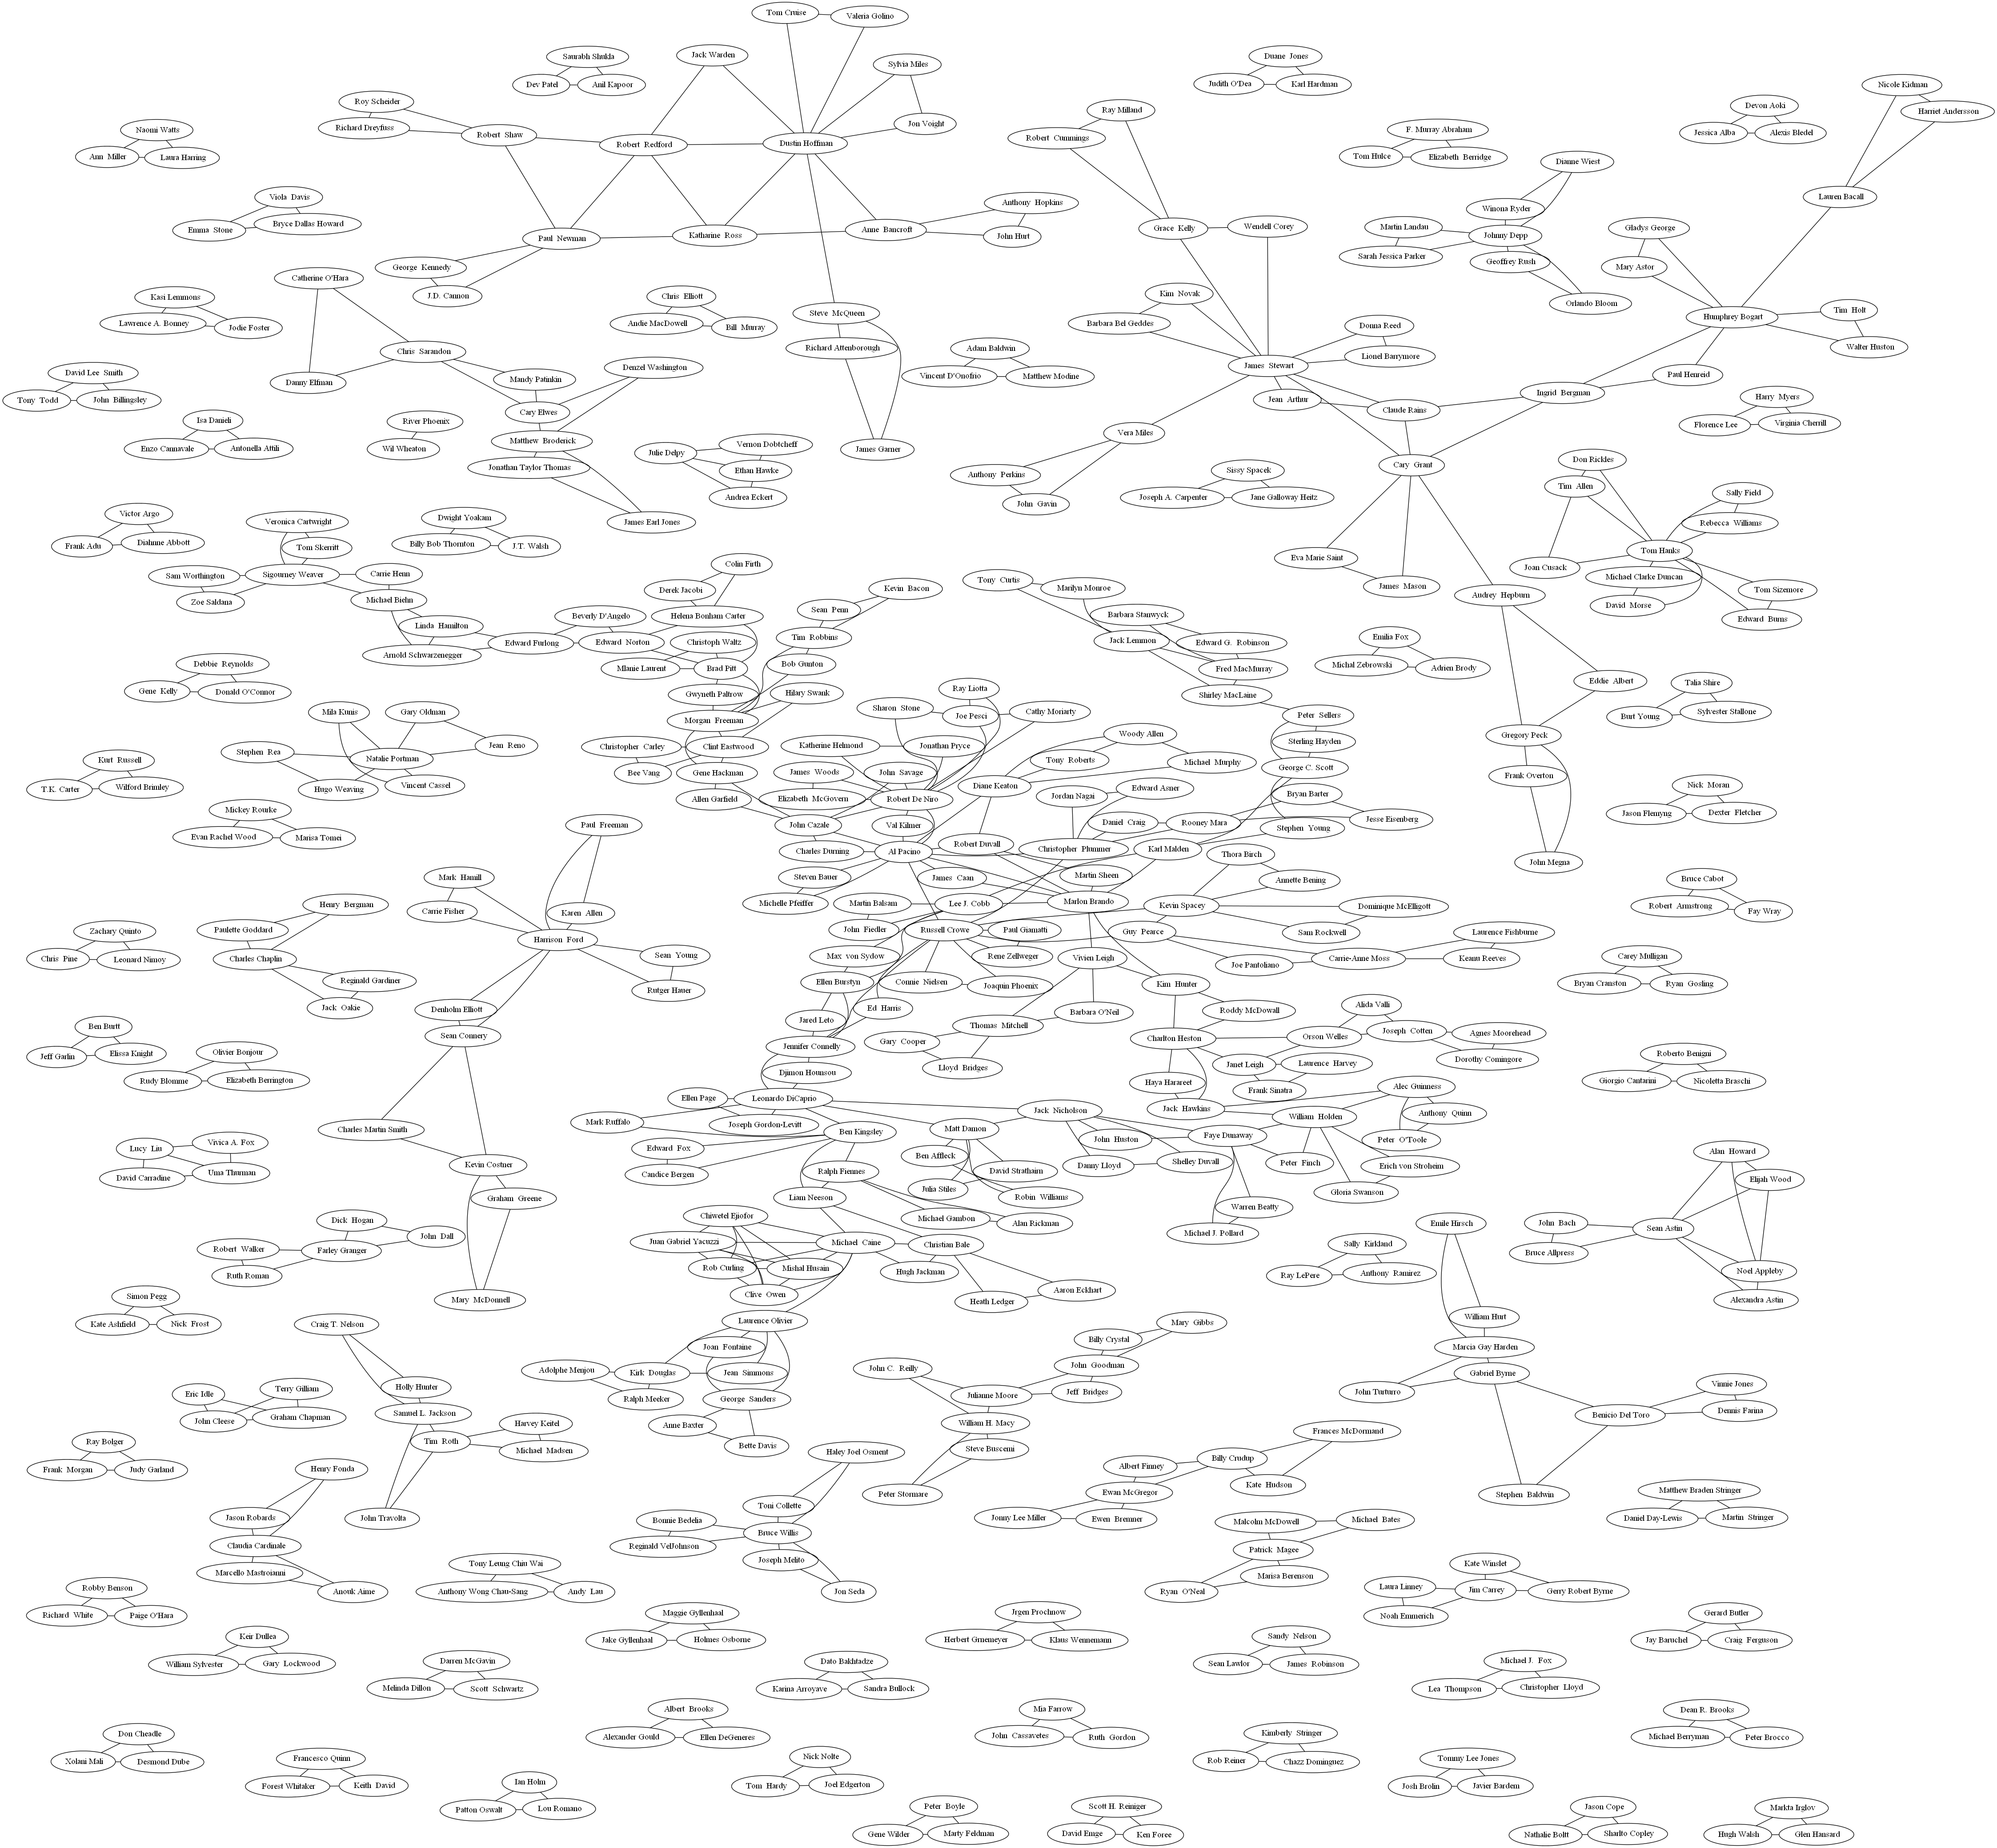
Graph of Actors Starring Together in Movies in IMDB
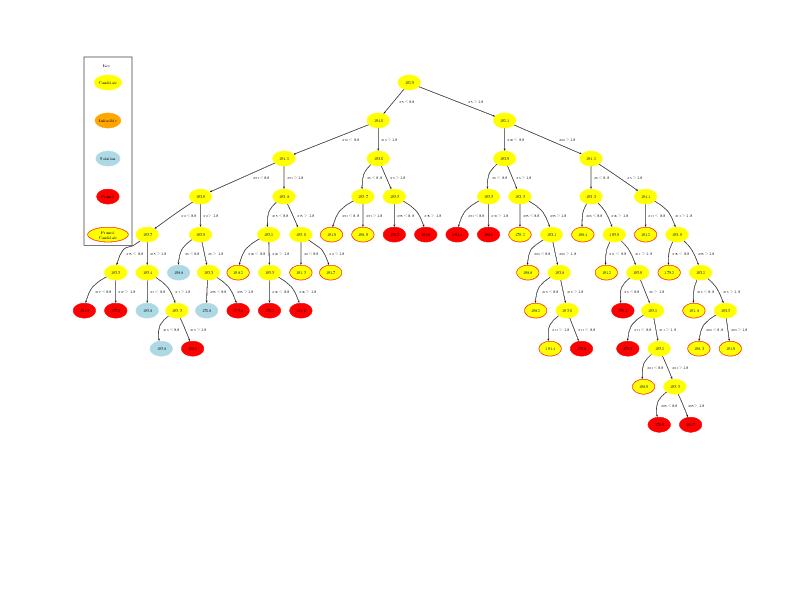
Branch and Bound Tree
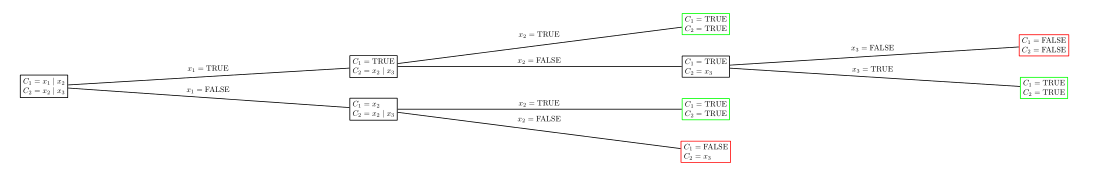
SAT Game Tree
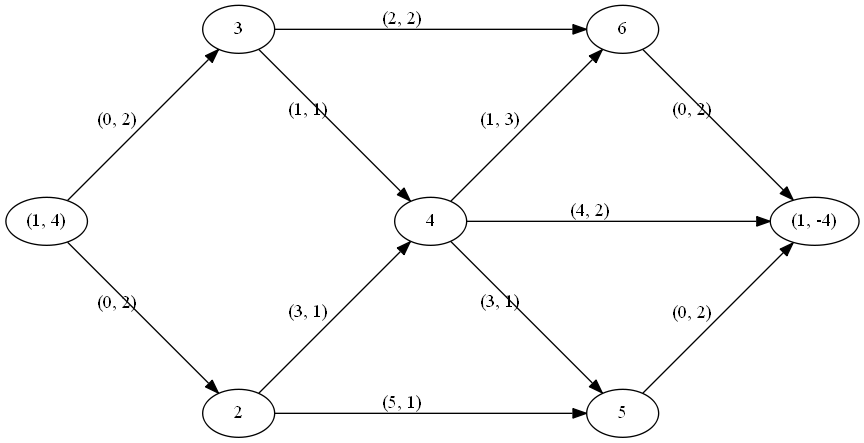
Flow Problem