damo is a user space tool for DAMON. Using
this, you can monitor the data access patterns of your system or workloads and
make data access-aware memory management optimizations.

Please click the below thumbnail to show the short demo video.
Follow below instructions and commands to monitor and visualize the access pattern of your workload.
$ # ensure DAMON is enabled on your kernel
$ # install damo from PyPI, or use your distribution's package manager
$ sudo pip3 install damo
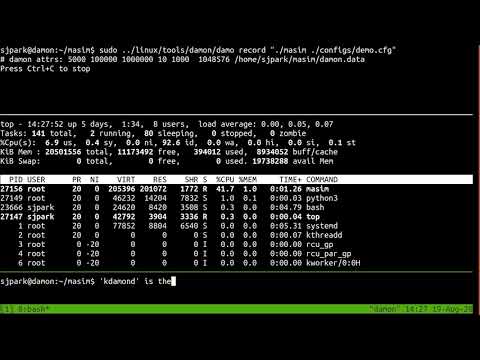
$ sudo damo record $(pidof <your workload>)
$ sudo damo report heats --heatmap stdout --stdout_heatmap_color emotion
The last command will show the access pattern of your workload, like below:


Please refer to 'Install' section of the project webpage.
The below sections provide quick introductions for damo's major features.
For more detailed usage, please refer to USAGE.md file.
Nothing at all but indicate which version is more fresh. A higher version number means it is more recently released.
It will install the latest stable version of damo. If you want, you can
also install less stable but more fresh damo from source code. For that,
fetch the next branch of the source tree and use damo executable file in
the tree.
$ git clone https://github.com/awslabs/damo -b next
Please refer to CONTRIBUTING file.
Why some subcommands are not documented on USAGE.md file?
Only sufficiently stabilized features are documented there. In other words, any feature that not documented on USAGE.md are in experimental stage. Such experimental features could be deprecated and removed without any notice and grace periods. The documented features could also be deprecated, but those will provide some notification and grace periods.
Below are quick introductions for damo's major features.
For more detailed usage, please refer to USAGE.md file.
Below commands repeatedly get a snapshot of the access pattern of a program for every second.
$ git clone https://github.com/sjp38/masim
$ cd masim; make; ./masim ./configs/zigzag.cfg --silent &
$ sudo damo start --target_pid $(pidof masim)
$ while :; do sudo damo show; sleep 1; done
The first two lines of the commands get an artificial memory access generator program and run it in the background. It will repeatedly access two 100 MiB-sized memory regions one by one. You can substitute this with your real workload.
The third line asks damo to start monitoring the access pattern of the
process. Finally, the last line retries a snapshot of the monitoring results
every second and show on terminal.
Below commands record memory access patterns of a program and save the
monitoring results in damon.data file.
$ git clone https://github.com/sjp38/masim
$ cd masim; make; ./masim ./configs/zigzag.cfg --silent &
$ sudo damo record -o damon.data $(pidof masim)
The first two lines of the commands get an artificial memory access generator
program and run it in the background. It will repeatedly access two 100
MiB-sized memory regions one by one. You can substitute this with your real
workload. The last line asks damo to record the access pattern in
damon.data file.
Below three commands visualize the recorded access patterns into three image files.
$ damo report heats --heatmap stdout
$ damo report wss --range 0 101 1
$ damo report wss --range 0 101 1 --sortby time --plot
-
access_pattern_heatmap.pngwill show the data access pattern in a heatmap, which shows when (x-axis) what memory region (y-axis) is how frequently accessed (color). -
wss_dist.pngwill show the distribution of the working set size. -
wss_chron_change.pngwill show how the working set size has chronologically changed.
You can show the images on a web page [1]. Those made with other realistic workloads are also available [2,3,4].
[1] https://damonitor.github.io/doc/html/latest/admin-guide/mm/damon/start.html#visualizing-recorded-patterns
[2] https://damonitor.github.io/test/result/visual/latest/rec.heatmap.1.png.html
[3] https://damonitor.github.io/test/result/visual/latest/rec.wss_sz.png.html
[4] https://damonitor.github.io/test/result/visual/latest/rec.wss_time.png.html
Below command makes every memory region of size >=4K that hasn't accessed for
=60 seconds in your workload to be swapped out. By doing this, you can make your workload more memory efficient with only modest performance overhead.
$ sudo damo start --damos_access_rate 0 0 --damos_sz_region 4K max \
                    --damos_age 60s max --damos_action pageout \
                    <pid of your workload>
Below are features that recently deprecated, or will be deprecated. If you depend on any of those, please report your usecase to the community via github issue, sj@kernel.org, damon@lists.linux.dev, and/or linux-mm@kvack.org.
Deprecated. Use the command of v2.0.2 or lower version of DAMO instead.
Deprecated. Use json_compressed format instead.
At the beginning, DAMO used its special binary format, namely record. It is
designed for lightweight saving of the monitoring results. It is difficult to
read, and not that efficient compared to fancy compression techniques. json
based monitoring results can be easier to read, and more efficient when
compression technique is used. Hence, the format is deprecated. You may
use damo convert_record_format of v2.0.2 or lower version of DAMO to convert
your old record binary format monitoring results files to the new format.
Deprecated. Use Python3.
For some old distros, DAMO initially supported Python2. Because Python2 is really old now, the support has deprecated. Please use Python3 or newer.
Deprecated. Use --damos_* command line options or json format input.
A simple DAMOS scheme specification format called one-line scheme specification
was initially supported. Because it is not flexible for extension of features,
it has deprecated now. You may use --damos_* command line options or json
format instead. You could use damo translate_damos ov v2.0.2 or lower
version of DAMO to convert your old single line DAMOS schemes specification to
the new json format.
Deprecated.
Early versions of DAMON supported in-kernel direct monitoring results record file generation. To control the overhead of it, DAMO allowed user to specify the size of buffer for the work. The feature has not merged into the mainline, and discarded. Hence the option was available for only few kernels that ported the feature. For most of kernels, tracepoint based record file generation is being used, and the overhead of the approach is subtle. Hence, the option has deprecated.


