data-flow-graph


Takes application logs from Elasticsearch (because you do have logs, right?) and visualizes how your data flow through the database allowing you to quickly identify which parts of your code inserts / updates / deletes / reads data from specific DB tables.
This can be extended to handle:
- message queues (Redis, RabbitMQ,
Scribe, ...) - HTTP services communication (GET, POST requests)
- Amazon's S3 storage operations
- tcpdump / varnishlog traffic between the hosts
- (use your imagintation)
data-flow-graph uses d3.js library to visualize the data flow (heavily inspired by this demo by Neil Atkinson).
Alternatively, you can generate *.gv file and render it using Graphviz.
Live demo
Graphs sharing
Via Gist
For easy dataflow sharing you can upload graph data in TSV form to Gist and have it visualized. Specific gist revisions are also supported.
Via s3
You can also upload TSV file to your s3 bucket (and have CORS set up there). Navigate to tsv.html or check the example from elecena.pl.
dataflow.tsv
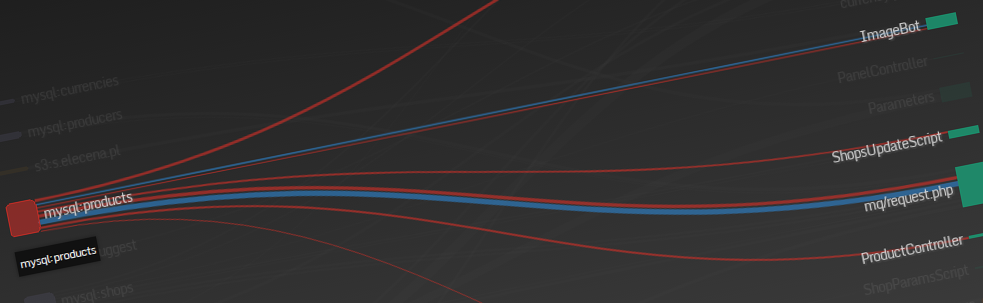
Visualization is generated for a TSV file with the following format:
(source node)\t(edge label)\t(target node)\t(edge weight - optional)\t(optional metadata displayed in edge on-hover tooltip)
Example
# a comment - will be ignored by the visualization layer
mq/request.php	_update	mysql:shops	0.0148	QPS: 0.1023
sphinx:datasheets	search	Elecena\Services\Sphinx	0.1888	QPS: 1.3053
mysql:products	getImagesToFetch	ImageBot	0.0007	QPS: 0.0050
sphinx:products	search	Elecena\Services\Sphinx	0.0042	QPS: 0.0291
sphinx:products	getIndexCount	Elecena\Services\Sphinx	0.0001	QPS: 0.0007
sphinx:products	products	Elecena\Services\Search	0.0323	QPS: 0.2235
currency.php	_	mysql:currencies	0.0001	QPS: 0.0008
sphinx:products	getLastChanges	StatsController	0.0002	QPS: 0.0014
mysql:suggest	getSuggestions	Elecena\Services\Sphinx	0.0026	QPS: 0.0181
mq/request.php	_delete	mysql:shops_stats	0.0004	QPS: 0.0030
sphinx:parameters	getDatabaseCount	Parameters	0.0002	QPS: 0.0010
Node names can by categorized by adding a
labelfollowed by:(e.g.mysql:foo,sphinx:index,solr:products,redis:queue)
Generating TSV file for data flow
You can write your own tool to analyze logs. It just needs to emit TSV file that matches the above format.
sources/elasticsearch/logs2dataflow.py is here as an example - it was used to generate TSV for a demo of this tool. 24 hours of logs from elecena.pl were analyzed (1mm+ of SQL queries).
Python module
pip install data_flow_graph
Please refer to /test directory for examples on how to use helper functions to generate Graphviz and TSV-formatted data flows.
