Datapackage Pipelines Metrics plugin

Allow to gather metrics about running pipelines, combining with Grafana to visualize and produce graphs and dashboards such as this:
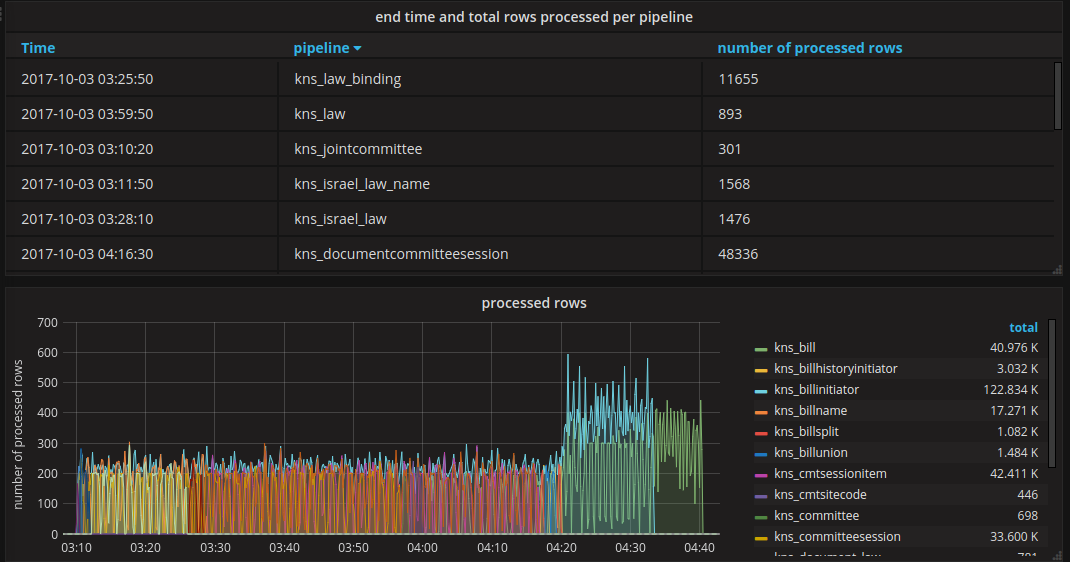 (https://next.oknesset.org/grafana/dashboard/db/knesset-dataservice-pipelines?orgId=1)
Sends the following measurements:
-
processed_row- sent after rows were processed, tracks the number of processed rows over time- this metric is sent in batches of 100 rows, see below on how to modify this behavior
-
processed_resources- sent after each resource is done processing, sends a value of the number of rows processed
Metrics are tagged automatically based on datapackage and resource name, or you can can provide the tags as parameters to the metrics.send processor.
Supported backends:
- InfluxDB - a simple, lightweight time-series DB
Feel free to open a PR to support additional backends
Usage
Install the plugin in an existing Datapackage Pipelines project:
pip install datapackage-pipelines-metrics
Set the following environment variables to enable the plugin:
-
DPP_INFLUXDB_URL- URL to the InfluxDB (e.g. http://influxdb:8086) - (optional)
DPP_INFLUXDB_DB- Name of the InfluxDB database to send the metrics to (default = dpp) - (optional)
DPP_INFLUXDB_ROWS_BATCH_SIZE- how many rows to batch together to a single metric (default = 100)
If the DPP_INFLUXDB_URL environment variable is not set - the plugin will have no effect.
There are 2 main ways to integrate this plugin into an existing Datapackage Pipelines installation, you can also combine them, depending on what you need
Automatic metrics for all pipelines
Uses a datapackage pipelines source spec file to inject the metrics sending processor at the end of every pipeline.
To use it, rename your existing pipeline-spec.yaml to metrics.source-spec.yaml
If you already use a pipeline source spec, you can append the metrics using the append_metrics function which accepts an existing pipeline_details and appends the metrics step. You can see an example of such integration here
Manual metrics using metrics.send processor
Use the metrics.send processor in your pipeline specs.
It accepts the following pipeline parameters:
- (optional)
tags- key-value pairs which will be used to tag the metric (default = datapackage and resource names) - (optional)
row-batch-size- how many rows to batch together to a single metric (default = 100)
Development
For local development on this project:
- You should be inside an activated Python 3.6 virtualenv
- Start InfluxDB and Grafana servers:
docker-compose up -d
- Install the Python package
pip install -e .
- Run the test pipeline
source .env.exampledpp run ./tests/noise
- Log-in to grafana
- http://localhost:13000
- default username/password is admin/admin
- Add a datasource
- Name: influxdb
- Type: InfluxDB
- Url: http://localhost:18086
- Access: direct
- Database: dpp
- Import the metrics dashboard
- Dashboards > Import
- Upload the dashboard file
grafana-dashboard.json
- View the dashboard
- If you ran the pipelines you should see some metrics
- You can use the following snippet to keep running the pipeline and check the metrics in real-time
while true; do dpp run ./tests/noise; done
