

DvG_PyQtGraph_ThreadSafe
PyQtGraph library providing thread-safe plot curves with underlying (ring) buffers.
Supports PyQt5, PyQt6, PySide2 and PySide6.
- Github: https://github.com/Dennis-van-Gils/python-dvg-pyqtgraph-threadsafe
- PyPI: https://pypi.org/project/dvg-pyqtgraph-threadsafe
Installation:
pip install dvg-pyqtgraph-threadsafe
Useful links
- Demos can be found in the demos folder.
- Benchmark tests and results can be found in the benchmark folder.
- Important notes on the specific use-case where another thread is actively requesting data at a high rate from an external device (e.g. an Arduino) to be pushed into a ThreadSafeCurve can be found here.
Overview
Classes HistoryChartCurve, BufferedPlotCurve & PlotCurve wrap around
a pyqtgraph.PlotDataItem instance, called a curve for convenience. Data
can be safely appended or set from out of any thread.
The (x, y)-curve data is buffered internally to the class, relying on either a circular/ring buffer or a regular array buffer:
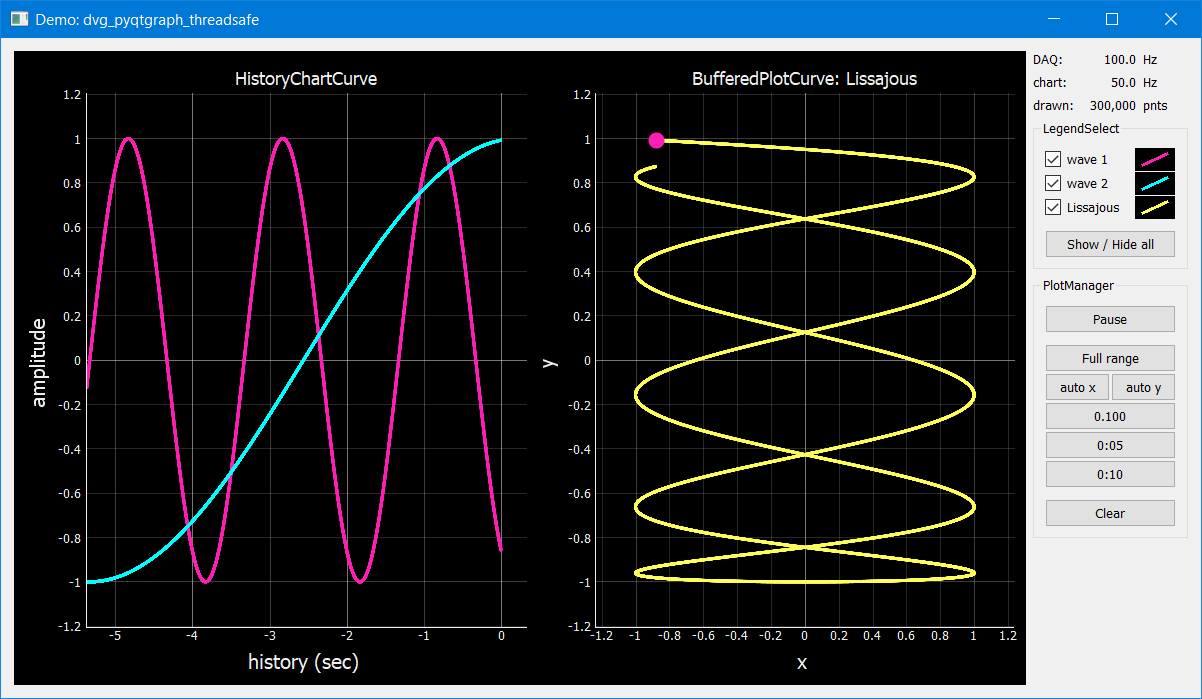
- HistoryChartCurve
- Ring buffer. The plotted x-data will be shifted such that the right-side is always set to 0. I.e., when x denotes time, the data is plotted backwards in time, hence the name history chart. The most recent data is on the right-side of the ring buffer.
- BufferedPlotCurve
- Ring buffer. Data will be plotted as is. Can also act as a Lissajous figure.
- PlotCurve
- Regular array buffer. Data will be plotted as is.
Usage:
import sys
from PyQt5 import QtWidgets
import pyqtgraph as pg
from dvg_pyqtgraph_threadsafe import HistoryChartCurve

class MainWindow(QtWidgets.QWidget):
    def __init__(self, parent=None, **kwargs):
        super().__init__(parent, **kwargs)

        self.gw = pg.GraphicsLayoutWidget()
        self.plot_1 = self.gw.addPlot()

        # Create a HistoryChartCurve and have it wrap around a new PlotDataItem
        # as set by argument `linked_curve`.
        self.tscurve_1 = HistoryChartCurve(
            capacity=5,
            linked_curve=self.plot_1.plot(pen=pg.mkPen('r')),
        )

        grid = QtWidgets.QGridLayout(self)
        grid.addWidget(self.gw)

app = QtWidgets.QApplication(sys.argv)
window = MainWindow()

# The following line could have been executed from inside of another thread:
window.tscurve_1.extendData([1, 2, 3, 4, 5], [10, 20, 30, 20, 10])

# Draw the curve from out of the main thread
window.tscurve_1.update()

window.show()
sys.exit(app.exec_())
Benchmark
If you intend to use this library to plot 100.000s of points at a high frame rate on your integrated GPU instead of on a dedicated (performance) GPU, you might run into performance issues. Even when OpenGL hardware acceleration is enabled.
I recommend you run the performance benchmark found in the
benchmark folder.
It can test for different PyQtGraph versions and Qt libraries on your
GPU of choice. I have found that the older pyqtgraph 0.11 library sometimes
results in a better performance than pyqtgraph 0.12 on integrated GPUs.
See benchmark results.
API
class ThreadSafeCurve(capacity: Optional[int], linked_curve: pg.PlotDataItem, shift_right_x_to_zero: bool = False, use_ringbuffer = None)
Provides the base class for a thread-safe plot curve to which (x, y)-data can be safely appended or set from out of any thread. It will wrap around the passed argument
linked_curveof typepyqtgraph.PlotDataItemand will manage the (x, y)-data buffers underlying the curve.Intended multi-threaded operation: One or more threads push new data into the
ThreadSafeCurve-buffers. Another thread performs the GUI refresh by callingupdate()which will redraw the curve according to the current buffer contents.
- Args:
- capacity (
int, optional):When an integer is supplied it defines the maximum number op points each of the x-data and y-data buffers can store. The x-data buffer and the y-data buffer are each a ring buffer. New readings are placed at the end (right-side) of the buffer, pushing out the oldest readings when the buffer has reached its maximum capacity (FIFO). Use methods
appendData()andextendData()to push in new data.When
Noneis supplied the x-data and y-data buffers are each a regular array buffer of undefined length. Use methodsetData()to set the data.- linked_curve (
pyqtgraph.PlotDataItem):- Instance of
pyqtgraph.PlotDataItemto plot the buffered data out into.- shift_right_x_to_zero (
bool, optional):When plotting, should the x-data be shifted such that the right-side is always set to 0? Useful for history charts.
Default: False
- use_ringbuffer (
bool, deprecated):- Deprecated since v3.1.0. Defined for backwards compatibility. Simply supply a value for
capacityto enable use of a ring buffer.- Attributes:
- x_axis_divisor (
float):The x-data in the buffer will be divided by this factor when the plot curve is drawn. Useful to, e.g., transform the x-axis units from milliseconds to seconds or minutes.
Default: 1
- y_axis_divisor (
float):Same functionality as
x_axis_divisor.Default: 1
Methods
-
appendData(x, y)-
Append a single (x, y)-data point to the ring buffer.
-
extendData(x_list, y_list)-
Extend the ring buffer with a list of (x, y)-data points.
-
setData(x_list, y_list)-
Set the (x, y)-data of the regular array buffer.
-
update(create_snapshot: bool = True)-
Update the data behind the curve by creating a snapshot of the current contents of the buffer, and redraw the curve on screen.
You can suppress updating the data behind the curve by setting parameter
create_snapshotto False. The curve will then only be redrawn based on the old data. This is useful when the plot is paused.
-
clear()-
Clear the contents of the curve and redraw.
-
name()-
Get the name of the curve.
-
isVisible() -> bool -
setVisible(state: bool = True) -
setDownsampling(*args, **kwargs)-
All arguments will be passed onto method
pyqtgraph.PlotDataItem.setDownsampling()of the underlying curve.
Properties
-
-
size -> Tuple[int, int]: - Number of elements currently contained in the underlying (x, y)-
buffers of the curve. Note that this is not necessarily the number of
elements of the currently drawn curve. Instead, it reflects the current
sizes of the data buffers behind it that will be drawn onto screen by
the next call to
update().
-
class HistoryChartCurve(capacity: int, linked_curve: pg.PlotDataItem)
Bases:
ThreadSafeCurveProvides a thread-safe curve with underlying ring buffers for the (x, y)-data. New readings are placed at the end (right-side) of the buffer, pushing out the oldest readings when the buffer has reached its maximum capacity (FIFO). Use methods
appendData()andextendData()to push in new data.The plotted x-data will be shifted such that the right-side is always set to 0. I.e., when
xdenotes time, the data is plotted backwards in time, hence the name history chart.See class
ThreadSafeCurvefor more details.
class BufferedPlotCurve(capacity: int, linked_curve: pg.PlotDataItem)
Bases:
ThreadSafeCurveProvides a thread-safe curve with underlying ring buffers for the (x, y)-data. New readings are placed at the end (right-side) of the buffer, pushing out the oldest readings when the buffer has reached its maximum capacity (FIFO). Use methods
appendData()andextendData()to push in new data.See class
ThreadSafeCurvefor more details.
class PlotCurve(capacity: int, linked_curve: pg.PlotDataItem)
Bases:
ThreadSafeCurveProvides a thread-safe curve with underlying regular array buffers for the (x, y)-data. Use method
setData()to set the data.See class
ThreadSafeCurvefor more details.
class LegendSelect(curves: List[Union[pg.PlotDataItem, ThreadSafeCurve]], hide_toggle_button: bool = False, box_bg_color: QtGui.QColor = QtGui.QColor(0, 0, 0), box_width: int = 40, box_height: int = 23, parent=None)
Bases:
PyQt5.QtCore.QObjectCreates and manages a legend of all passed curves with checkboxes to show or hide each curve. The legend ends with a push button to show or hide all curves in one go. The full set of GUI elements is contained in attribute
gridof typePyQt5.QtWidget.QGridLayoutto be added to your GUI.The initial visibility, name and pen of each curve will be retrieved from the members within the passed curves, i.e.:
curve.isVisible()curve.name()curve.opts["pen"]Example grid:
□ Curve 1  [  /  ]
□ Curve 2  [  /  ]
□ Curve 3  [  /  ]
[ Show / Hide all]
- Args:
- linked_curves (
List[Union[pyqtgraph.PlotDataItem, ThreadSafeCurve]]):- List of
pyqtgraph.PlotDataItemorThreadSafeCurveto be controlled by the legend.- hide_toggle_button (
bool, optional):- Default: False
- box_bg_color (
QtGui.QColor, optional):Background color of the legend boxes.
Default:
QtGui.QColor(0, 0, 0)- box_width (
int, optional):- Default: 40
- box_height (
int, optional):- Default: 23
- Attributes:
- chkbs (
List[PyQt5.QtWidgets.QCheckbox]):- List of checkboxes to control the visiblity of each curve.
- painted_boxes (
List[PyQt5.QtWidgets.QWidget]):- List of painted boxes illustrating the pen of each curve.
- qpbt_toggle (
PyQt5.QtWidgets.QPushButton):- Push button instance that toggles showing/hiding all curves in one go.
- grid (
PyQt5.QtWidgets.QGridLayout):- The full set of GUI elements combined into a grid to be added to your GUI.
