expr
Create simple visualisations of mathematical operations on small datasets by rendering an expression graph, show your friends or serialise it for later.
Contents
Usage
Examples follow using the Python interactive shell
Starting out
Import some things from the module
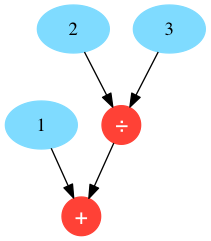
from expr import Expr, NumExprConstruct an expression
expr = Expr(
    operation_name='+',
    arguments=[
        NumExpr(number=1),
        Expr(
            operation_name='/',
            arguments=[
                NumExpr(number=2),
                NumExpr(number=3),
            ]
        )
    ]
)
Get an answer
>> expr.resolve()
1.6666666666666665
Draw a graph
>> graph = expr.graph()
>> graph.write_png('example.png')
True
example.png
Less verbosity
Import things using as to save your typing fingers by aliasing those
characters away. In Python we don't really need to care if functions specify
keyword or positional signatures, so let's not bother with those wordy
keywords, hey.
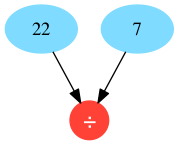
>>> from expr import Expr as E, NumExpr as N
>>> expr = E('/', [N(22), N(7)])
>>> expr.resolve()
3.142857142857143
>>> expr.graph().write_png('pi.png')
True
pi.png
Involving pandas
We can create expressions that involve more than just numbers ...
>>> import pandas
>>> from expr import (
...     Expr as E,
...     NumExpr as N,
...     DataFrameExpr as D,
... )
Create some stupid datasets
>>> def two_by_four():
... data = [(n + 1, n + 1) for n in range(4)]
... return pandas.DataFrame.from_records(data=data, columns=['a', 'b'])
>>> df_A = two_by_four()
>>> df_B = two_by_four()
>>> df_A
a b
0 1 1
1 2 2
2 3 3
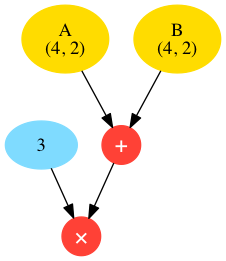
3 4 4Create the expression object, the DataFrameExpr object (aliased here
as D) takes an optional argument name which will be used as a label if
present, otherwise an automatically generated label will applied.
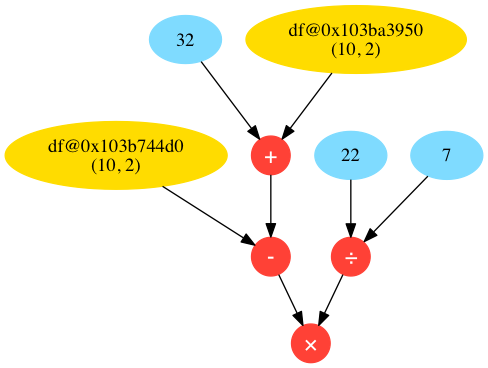
>>> expr = E('*', [N(3), E('+', [D(df_A, 'A'), D(df_B, 'B')])])
>>> expr.graph().write_png('dataframe.png')
True
>>> expr.resolve()
    0   1
0   6   6
1  12  12
2  18  18
3  24  24
dataframe.png
Serialising
Let's serialise the above example using JSON, any arguments passed to the
serialise method are used when the serialiser function is applied.
>>> import json
>>> print(expr.serialise(json.dumps, indent=4))
{
    "__type__": "Expr",
    "operation_name": "*",
    "arguments": [
        {
            "__type__": "NumExpr",
            "number": 3.0
        },
        {
            "__type__": "Expr",
            "operation_name": "+",
            "arguments": [
                {
                    "__type__": "DataFrameExpr",
                    "name": "A",
                    "dataframe": {
                        "a": {
                            "0": 1,
                            "1": 2,
                            "2": 3,
                            "3": 4
                        },
                        "b": {
                            "0": 1,
                            "1": 2,
                            "2": 3,
                            "3": 4
                        }
                    }
                },
                {
                    "__type__": "DataFrameExpr",
                    "name": "B",
                    "dataframe": {
                        "a": {
                            "0": 1,
                            "1": 2,
                            "2": 3,
                            "3": 4
                        },
                        "b": {
                            "0": 1,
                            "1": 2,
                            "2": 3,
                            "3": 4
                        }
                    }
                }
            ]
        }
    ]
}
Getting funccy
The final expression provided in this package is FuncExpr, which applies
arbitrary functions to the arguments supplied (which should be objects
implementing a resolve method). Keywords are also applied, probably for
specifying options, which do not have to be expression objects. A contrived
example of FuncExpr use follows.
Do some smart imports
import pandas
from expr import (
    Expr as E,
    NumExpr as N,
    DataFrameExpr as D,
    FuncExpr as F,
)
Define a factory function for creating DataFrame objects
def x_by_y(x, y, columns=False):
    data = [[a + b for b in range(x)] for a in range(y)]
    if columns is False:
        columns = [chr(97 + c) for c in range(x)]
    return pandas.DataFrame.from_records(data=data, columns=columns)
Crank out some df's for later use
df_A = x_by_y(3, 4)
df_B = x_by_y(3, 4)
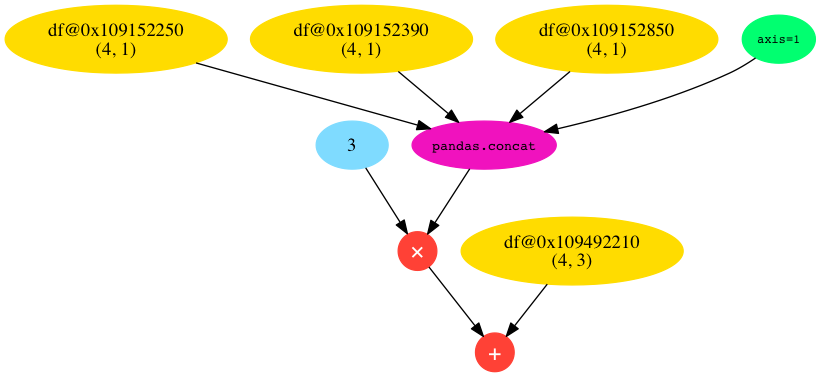
df_C = x_by_y(3, 4)Now set up out expression and look at its graph
expr = E('+',
    [
        E('*',
            [
                N(3),
                F('pandas.concat',
                    [
                        D(x_by_y(1, 4, ['a'])),
                        D(x_by_y(1, 4, ['b'])),
                        D(x_by_y(1, 4, ['c'])),
                    ], axis=1
                )
            ]
        ),
        D(x_by_y(3, 4))
    ]
)
G = expr.graph()
G.write_png('func.png')
func.png
Crazy ish
Why not very clumsily visualise a call stack for your audience's pleasure?
Known Issues
If you like YAML, serialising pandas objects, may be problematic, but
JSON should be fine.
Also
Colours courtesy of clrs.cc
