![]()


grafana-wtf - grep through all Grafana entities in the spirit of git-wtf.
Attention
This program can put significant load on your Grafana instance and the underlying database machinery. Handle with care!
Search Grafana (dashboards and datasources) for string "weatherbase". :
grafana-wtf find weatherbaseDisplay 50 most recent changes across all dashboards. :
grafana-wtf log --number=50Explore dashboards and datasources in more detail. :
grafana-wtf explore dashboards
grafana-wtf explore datasources
Explore plugins. :
grafana-wtf plugins list
grafana-wtf plugins status
Run with Docker:
# Access Grafana instance on localhost, without authentication.
docker run --rm -it \
    --env GRAFANA_URL="http://host.docker.internal:3000" \
    ghcr.io/panodata/grafana-wtf grafana-wtf info

# Access Grafana instance with authentication.
docker run --rm -it \
    --env GRAFANA_URL="https://grafana.example.org/grafana" \
    --env GRAFANA_TOKEN="eyJrIjoiWHg...dGJpZCI6MX0=" \
    ghcr.io/panodata/grafana-wtf grafana-wtf info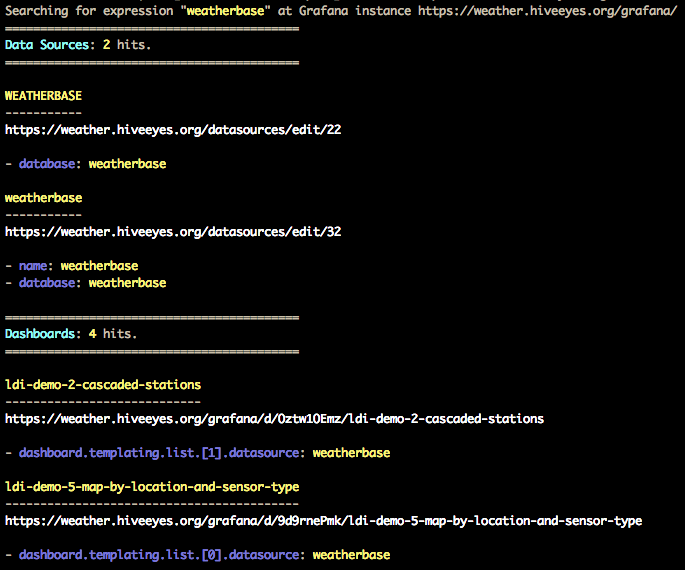

pip install grafana-wtfPlease take these steps to create an API key with your Grafana instance:
- Go to
https://daq.example.org/grafana/org/apikeys. - Choose "New API Key".
- Key name: grafana-wtf
- Role: Admin
- From the output
curl -H "Authorization: Bearer eyJrIjoiWHg...dGJpZCI6MX0=" ..., please take note of the Bearer token. This is your Grafana API key.
To configure to which Grafana instance to connect to, and how to authenticate, use the --grafana-url and --grafana-token command line options.
Alternatively, before running grafana-wtf, you can define URL and access token of your Grafana instance by using environment variables:
export GRAFANA_URL=https://daq.example.org/grafana/
export GRAFANA_TOKEN=eyJrIjoiWHg...dGJpZCI6MX0=
In order to accept untrusted SSL certificates, append the ?verify=no query string to the GRAFANA_URL:
export GRAFANA_URL=https://daq.example.org/grafana/?verify=nografana-wtf will cache HTTP responses for 60 minutes by default, in order to save resources, by not hitting the server each server. You can configure that setting by using the --cache-ttl option, or the CACHE_TTL environment variable.
When invoking the program with the --drop-cache option, it will drop its cache upfront.
# Display a bunch of meta information and statistics.
grafana-wtf info --format=yaml

# Display Grafana version.
grafana-wtf info --format=json | jq -r '.grafana.version'How to find unused data sources? :
# Display all data sources and the dashboards using them, as well as unused data sources.
grafana-wtf explore datasources --format=yaml

# Display names of unused datasources as a flat list.
grafana-wtf explore datasources --format=json | jq -r '.unused[].datasource.name'How to find dashboards which use non-existing data sources? :
# Display some details of all dashboards, including names of missing data sources.
grafana-wtf explore dashboards --format=yaml

# Display only dashboards which have missing data sources, along with their names.
grafana-wtf explore dashboards --format=json | \
    jq '.[] | select(.datasources_missing) | .dashboard + {ds_missing: .datasources_missing[] | [.name]}'
How to find dashboards using specific data sources? :
# Display all dashboards which use a specific data source, filtered by data source name.
grafana-wtf explore dashboards --format=json | jq '.[] | select(.datasources | .[].type=="<datasource_name>")'

# Display all dashboards using data sources with a specific type. Here: InfluxDB.
grafana-wtf explore dashboards --format=json | jq '.[] | select(.datasources | .[].type=="influxdb")'
How to list all queries used in all dashboards? :
grafana-wtf explore dashboards --data-details --queries-only --format=json | \
jq '.[].details | values[] | .[] | .expr,.jql,.query,.rawSql | select( . != null and . != "" )'Find the string weatherbase throughout all dashboards and data sources:
grafana-wtf find weatherbaseReplace all occurrences of ldi_v2 with ldi_v3 within dashboard with UID _JJ22OZZk:
grafana-wtf --select-dashboard=_JJ22OZZk replace ldi_v2 ldi_v3In order to preview the changes, you should use the --dry-run option beforehand:
grafana-wtf --select-dashboard=_JJ22OZZk replace ldi_v2 ldi_v3 --dry-runWatching out for recent editing activity on any dashboards? :
# Display 50 most recent changes across all dashboards.
grafana-wtf log --number=50For discovering more command line parameters and their arguments, please invoke grafana-wtf --help and have a look at grafana-wtf examples.
git clone https://github.com/panodata/grafana-wtf
cd grafana-wtf

# Run all tests.
make test

# Run selected tests.
pytest --keepalive -vvv -k test_find_textual
![dependabot[bot]](https://avatars.githubusercontent.com/u/49699333?size=120)


