Graphviz-Artist


You just become an artist in graph drawing once you start using Graphviz-Artist.
If you don't have the demand of fine-grained controling upon generated graphs, the learning curve of graphviz-artist is actually horizontal.
This package provides a higher-level encapsulation for the python package graphviz, and you might
want to have a try at the latter.
Installation
- Install Graphviz.
pip install graphviz-artist
Quickstart
Undirected Graph
import graphviz_artist as ga

# make a graph
g = ga.Graph()

# make nodes
n1 = g.new()
n2 = g.new()
n3 = g.new()

# (>), (==) and (<) could create edges for graphs.
# n2 > n3 / n3 < n2 : there is an edge n2 -> n3
# (==) will be introduced later, as it's only meaningful to directed edges.
_ = n1 > n2 > n3 > n1

g.view()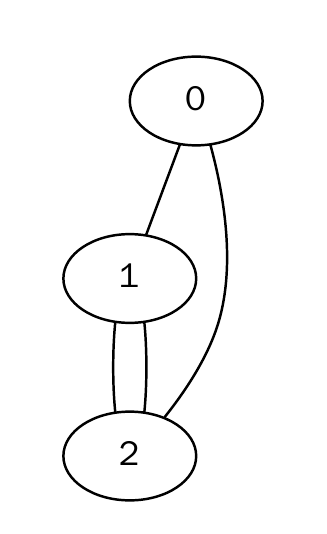
Directed Graph
import graphviz_artist as ga

# use attr module to see which Graphviz Attributes
# could be auto-completed.
import graphviz_artist.attr as attr

# use HorizontalGraph
g = ga.Graph(attr.HorizontalGraph)

# `attr.Shape("<name>")` to specify the shape of nodes.
n1 = g.new(attr.Label('hey'), attr.Shape.diamond)
n2 = g.new(attr.Label('hey'), attr.Shape.hexagon)
n3 = g.new(attr.Label('you'), attr.Shape.star)

# `attr.Directed()` makes a directed edge.
directed = attr.Directed()

# `attr.Label` to specify the text that edges display
edge_label = attr.Label("passed_here")

# `attr.Penwidth` to decide the width of edge glyph.
edge_size = attr.Penwidth(2.)

# in `a < b[b_to_c_attrs...] > c`, the edge `b -> c` will have attribute `b_to_c_attrs`.
_ = n3[directed, edge_label, edge_size] > n1[directed] == n2 > n3

g.view()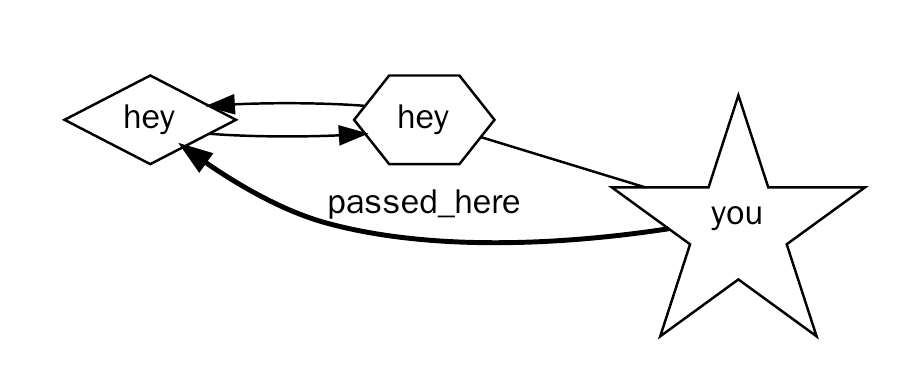
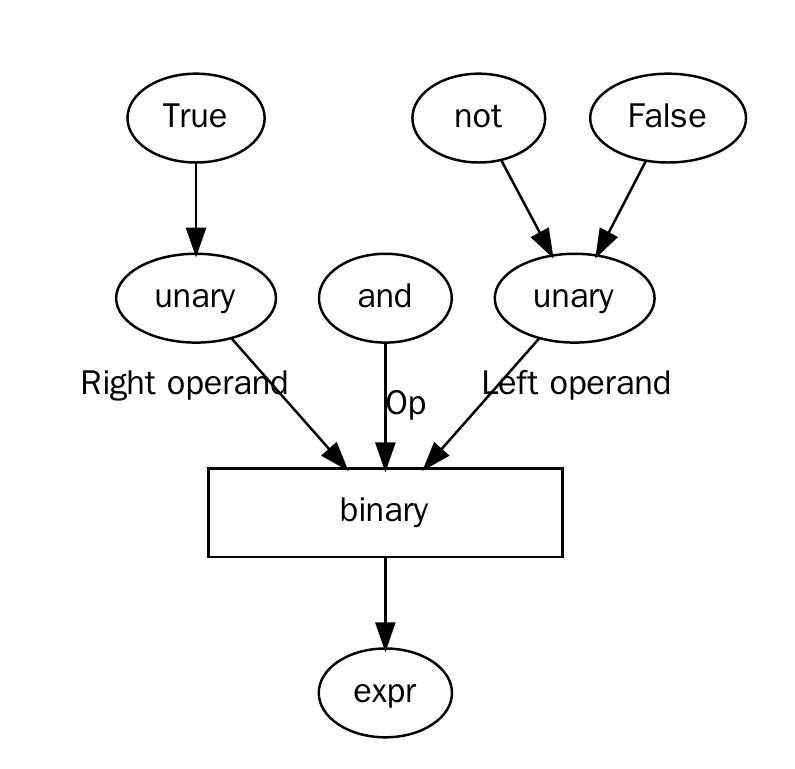
Expression Tree
import graphviz_artist as ga
import graphviz_artist.attr as attr

# make a graph
g = ga.Graph(directed=True)

new = g.new

# decl nodes
false = new(attr.Label("False"))
true = new(attr.Label("True"))
not_ = new(attr.Label("not"))
and_ = new(attr.Label("and"))

unary1 = new(attr.Label("unary"))
unary2 = new(attr.Label("unary"))
binary = new(attr.Label("binary"), attr.Width(2), attr.Shape.box)
expr = new(attr.Label("expr"))

# build graph
_ = false > unary1 < not_
_ = true > unary2

_ = and_[attr.Label('Op')] > binary

# XLabel: For edges, the label will be placed near the center of the edge.
_ = unary1[attr.XLabel("Left operand")] > binary
_ = unary2[attr.XLabel('Right operand')] > binary
_ = binary > expr

g.view()