![]()
Table of Contents
The gtfs-segments is a Python (3.9+) package that represents GTFS data for buses in a concise tabular manner using segments. The distribution of bus stop spacings can be viewed by generating histograms. The stop spacings can be visualized at the network, route, or segment level. The segment data can be exported to well-known formats such as .csv or .geojson for further analysis. Additionally, the package provides commands to download the latest data from @mobility data sources.
The package condenses the raw GTFS data by considering the services offered only on the busiest day(in the data). More discussion on the interpretation of different weightings for stop spacings, and the process in which the package condenses information can be seen in our paper. The usage of the package is detailed in documentation. The stop spacings dataset containing over 540 transit providers in the US generated using this package can be found on Harvard Dataverse.
The major dependencies of this library are the following packages.
|
|
The detailed list of package dependencies can be found in requirements.txt
Use pip to install the package.
pip install gtfs-segmentsℹ️ Windows users may have to download and install Microsoft Visual C++ distributions. Follow these instructions.
📓 Google Colab : You can install and use the
gtfs-segmentsvia google colab. Here is a tutorial to help you get started. Make a copy and get started with your work!
-
Clone the repo
git clone https://github.com/UTEL-UIUC/gtfs_segments.git
-
Install geopandas using the following code. Read more here
conda create -n geo_env -c conda-forge python=3.11 geopandas
conda activate geo_env
-
Install the
gtfs_segmentspackagecd gtfs_segments python setup.py install
ℹ️ For documentation, please refer to the Documentation
Import the package using
import gtfs_segmentsfrom gtfs_segments import fetch_gtfs_source
sources_df = fetch_gtfs_source()
sources_df.head()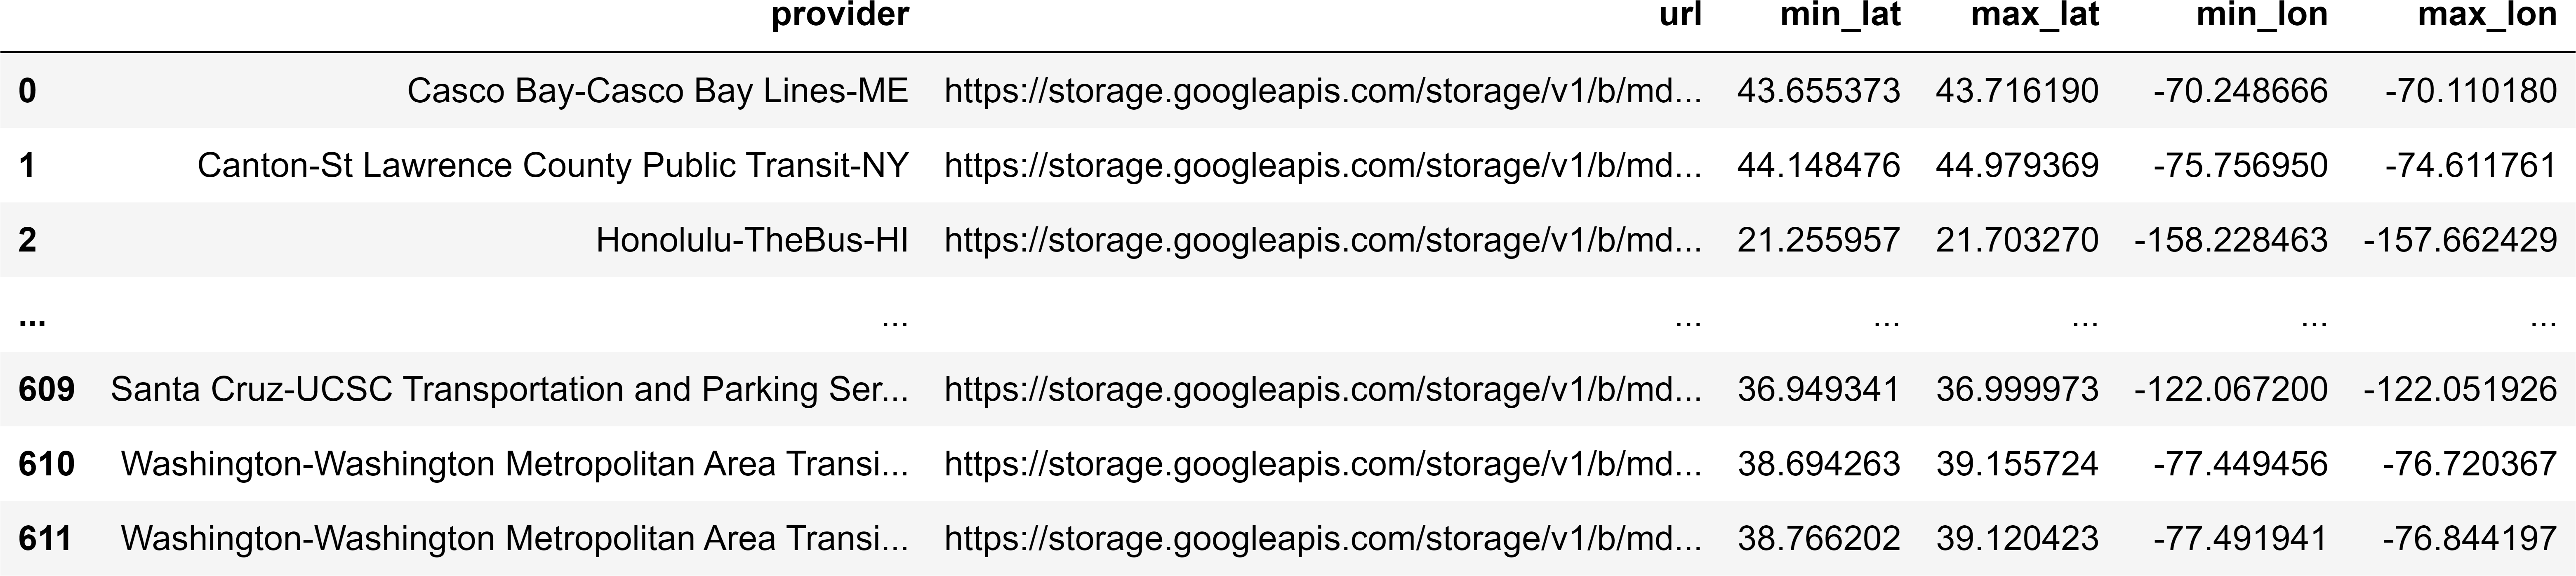
from gtfs_segments import fetch_gtfs_source
sources_df = fetch_gtfs_source(place ='Chicago')
sources_df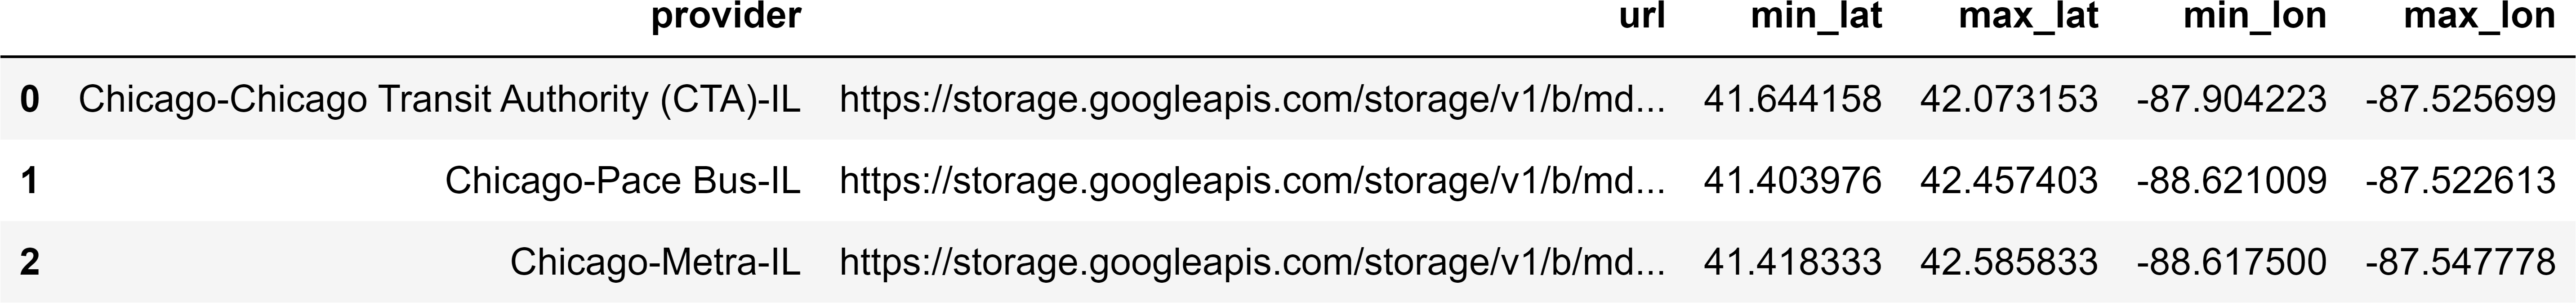
from gtfs_segments import download_latest_data
download_latest_data(sources_df,"output_folder")Download the GTFS .zip files from @transitfeeds or @mobility data.
from gtfs_segments import get_gtfs_segments
segments_df = get_gtfs_segments("path_to_gtfs_zip_file")
# [Optional] Run in parallel using multiple CPU cores
segments_df = get_gtfs_segments("path_to_gtfs_zip_file", parallel = True)
Alternatively, filter a specific agency by passing agency_id as a string or multiple agencies as list ["SFMTA",]
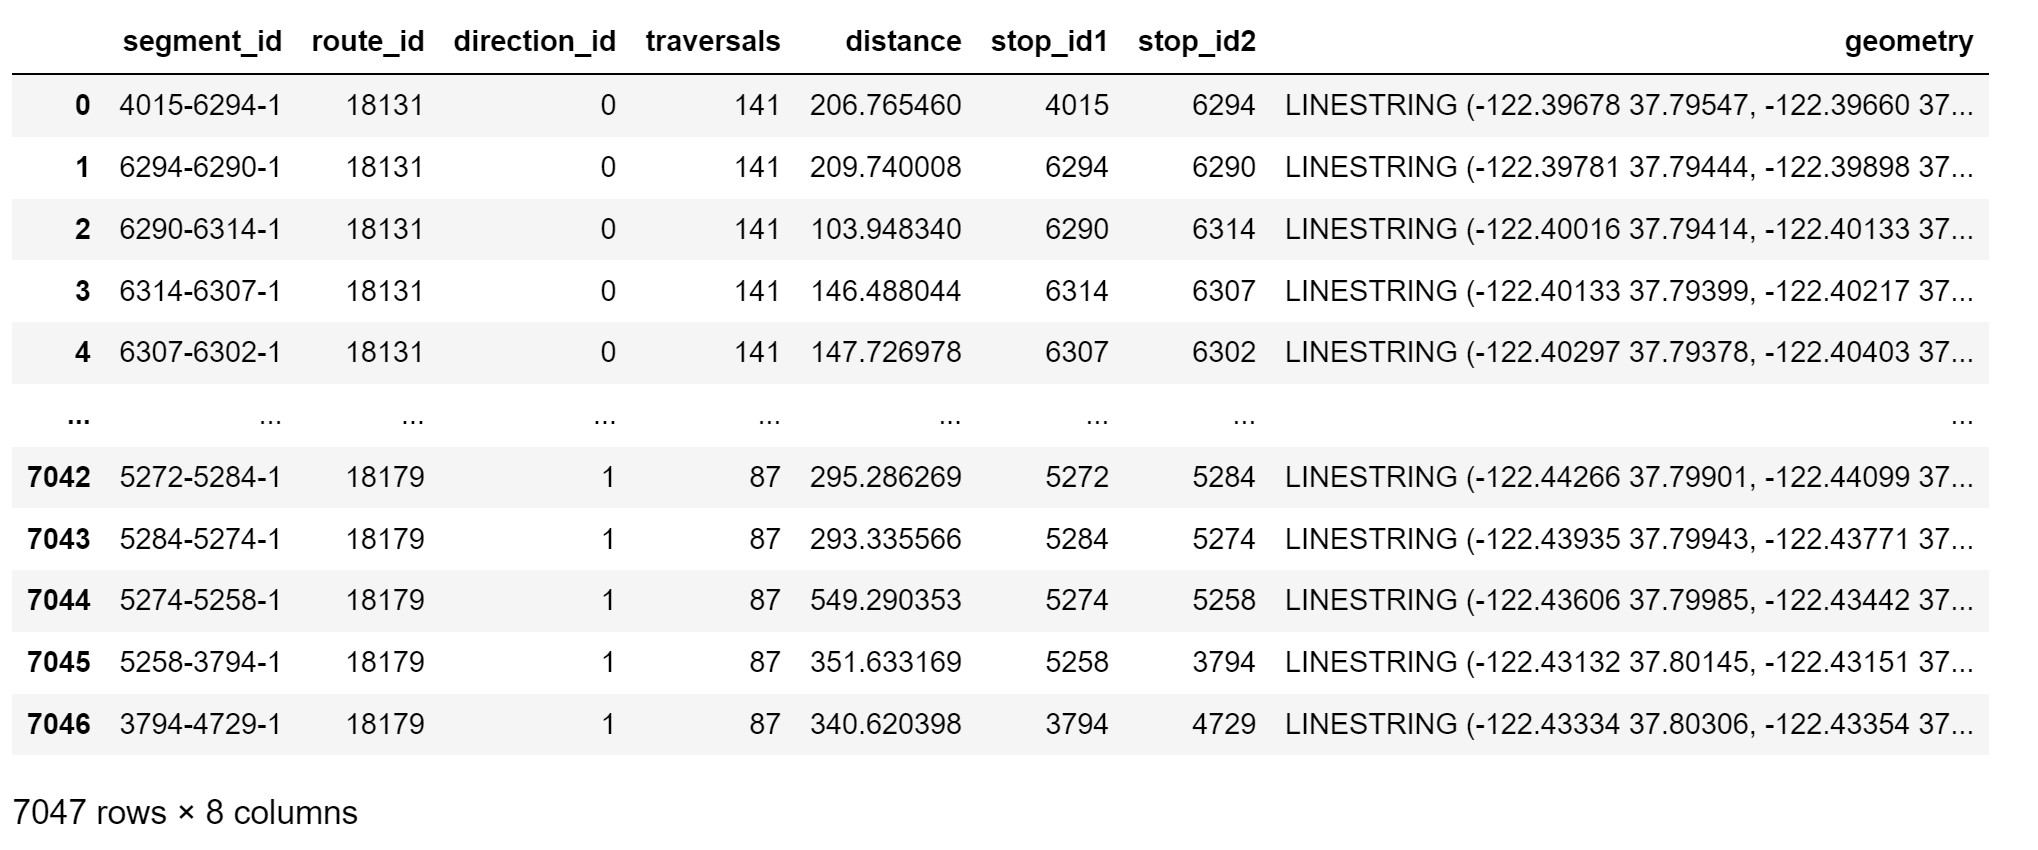
segments_df = get_gtfs_segments("path_to_gtfs_zip_file",agency_id = "SFMTA")
segments_df
-
segment_id: the segment's identifier, produced by gtfs-segments -
stop_id1: the identifier of the segment's beginning stop. The identifier is the same one the agency has chosen in the stops.txt file of its GTFS package. -
stop_id2: The identifier of the segment's ending stop. -
route_id: The same route ID listed in the agency's routes.txt file. -
direction_id: The route's direction identifier. -
traversals: The number of times the indicated route traverses the segment during the "measurement interval." The "measurement interval" chosen is the busiest day in the GTFS schedule: the day which has the most bus services running. -
distance: The length of the bus segment in meters. -
geometry: The segment's LINESTRING (a format for encoding geographic paths). All geometries are re-projected onto Mercator (EPSG:4326/WGS84) to maintain consistency. -
traversal_time: The time (in seconds) that it takes for the bus to traverse the segment. -
speed: The speed of the bus (in kmph) while traversing the segment. Default tonp.inf♾ in casetraversal_timeis zero.
Each row does not represent one segment. Rather, each row maps to a combination of a segment, a route that includes that segment, and a direction. For instance, a segment included in eight routes will appear as eight rows, which will have the same information except for route_id and traversals (since some routes might traverse the segment more than others). This choice enables filtering by route and preserves how many times each route traverses each segment during the measurement interval. The direction identifier is used for very rare cases (mostly loops) in which a route visits the same two stops, in the same order, but in different directions.
Visualize stop spacings at network, route and segments levels along with basemaps and stop locations.
ℹ️ For more information on visualization refer to the Visualization Tutorial
ℹ️ Alternatively, use
view_spacings_interactiveto view the stop spacings interactively.
from gtfs_segments import view_spacings
view_spacings(segments_df,route = '8',segment = '6364-3725-1',basemap=True)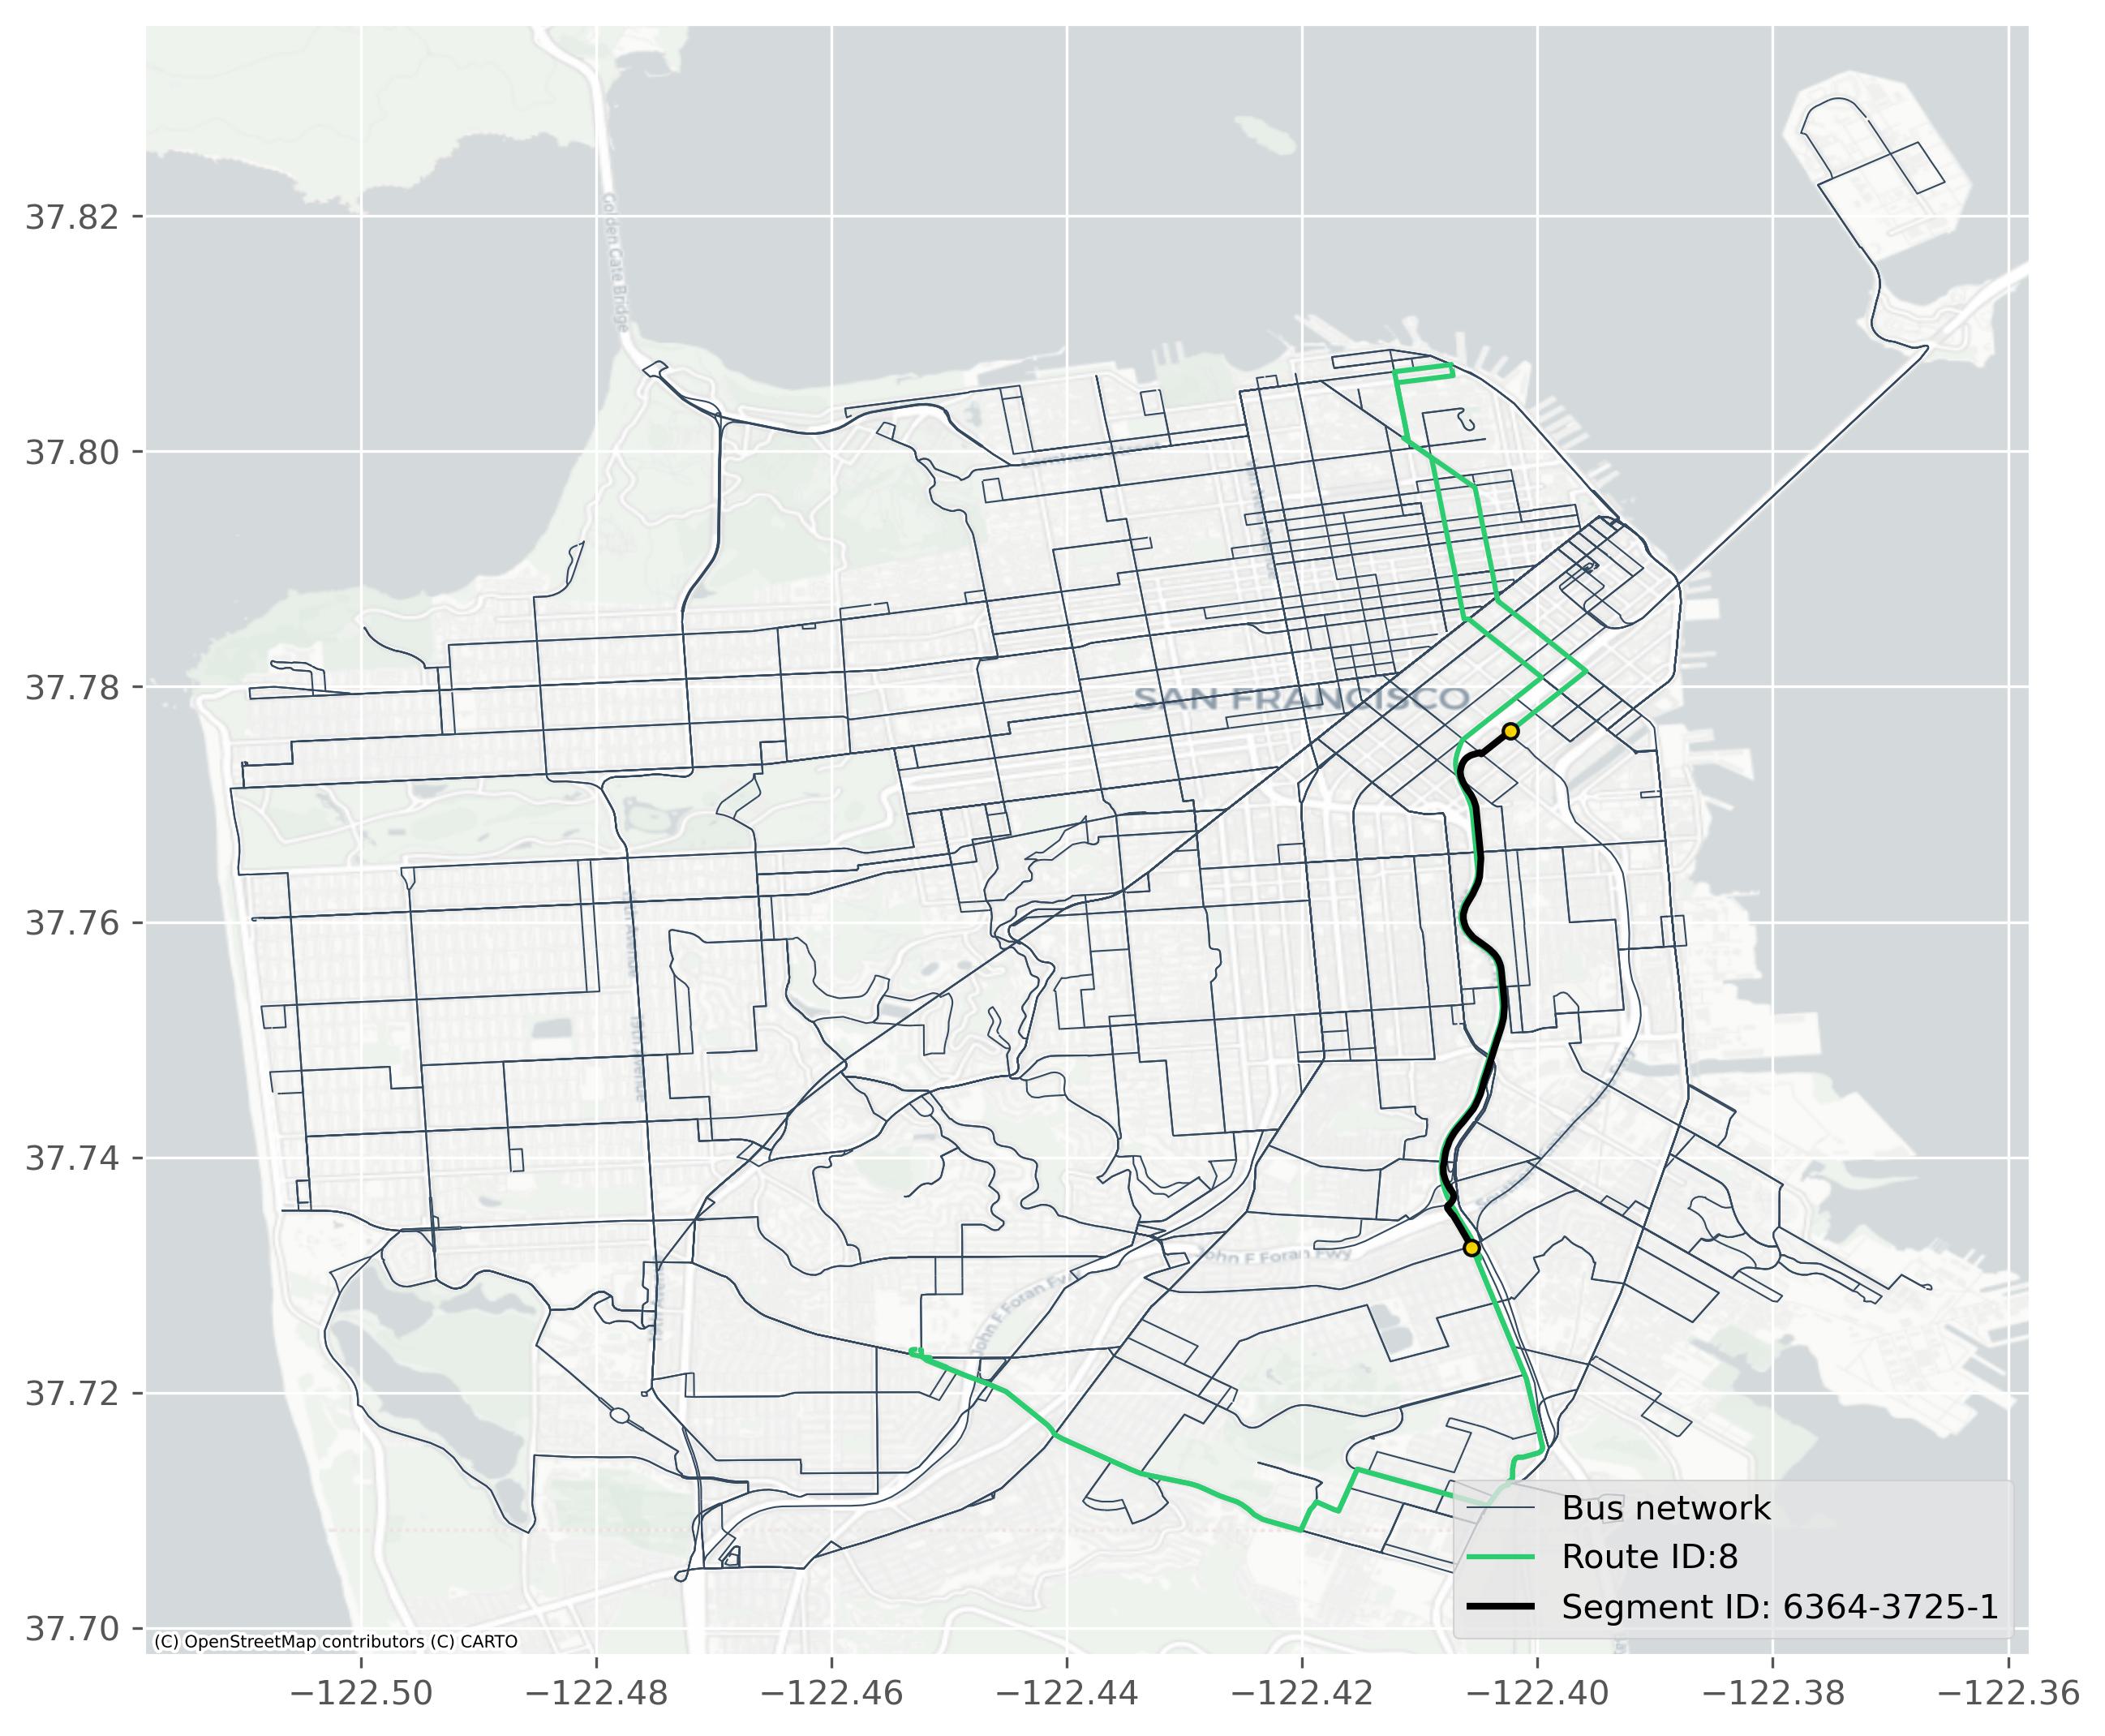
View the heatmap of stop spacings ("distance" as metric). Use Diverging colormaps to highlight narrow and wide spacings. Set light_mode = False for Dark mode.
from gtfs_segments import view_heatmap
f = view_heatmap(df, cmap='RdBu', light_mode=True)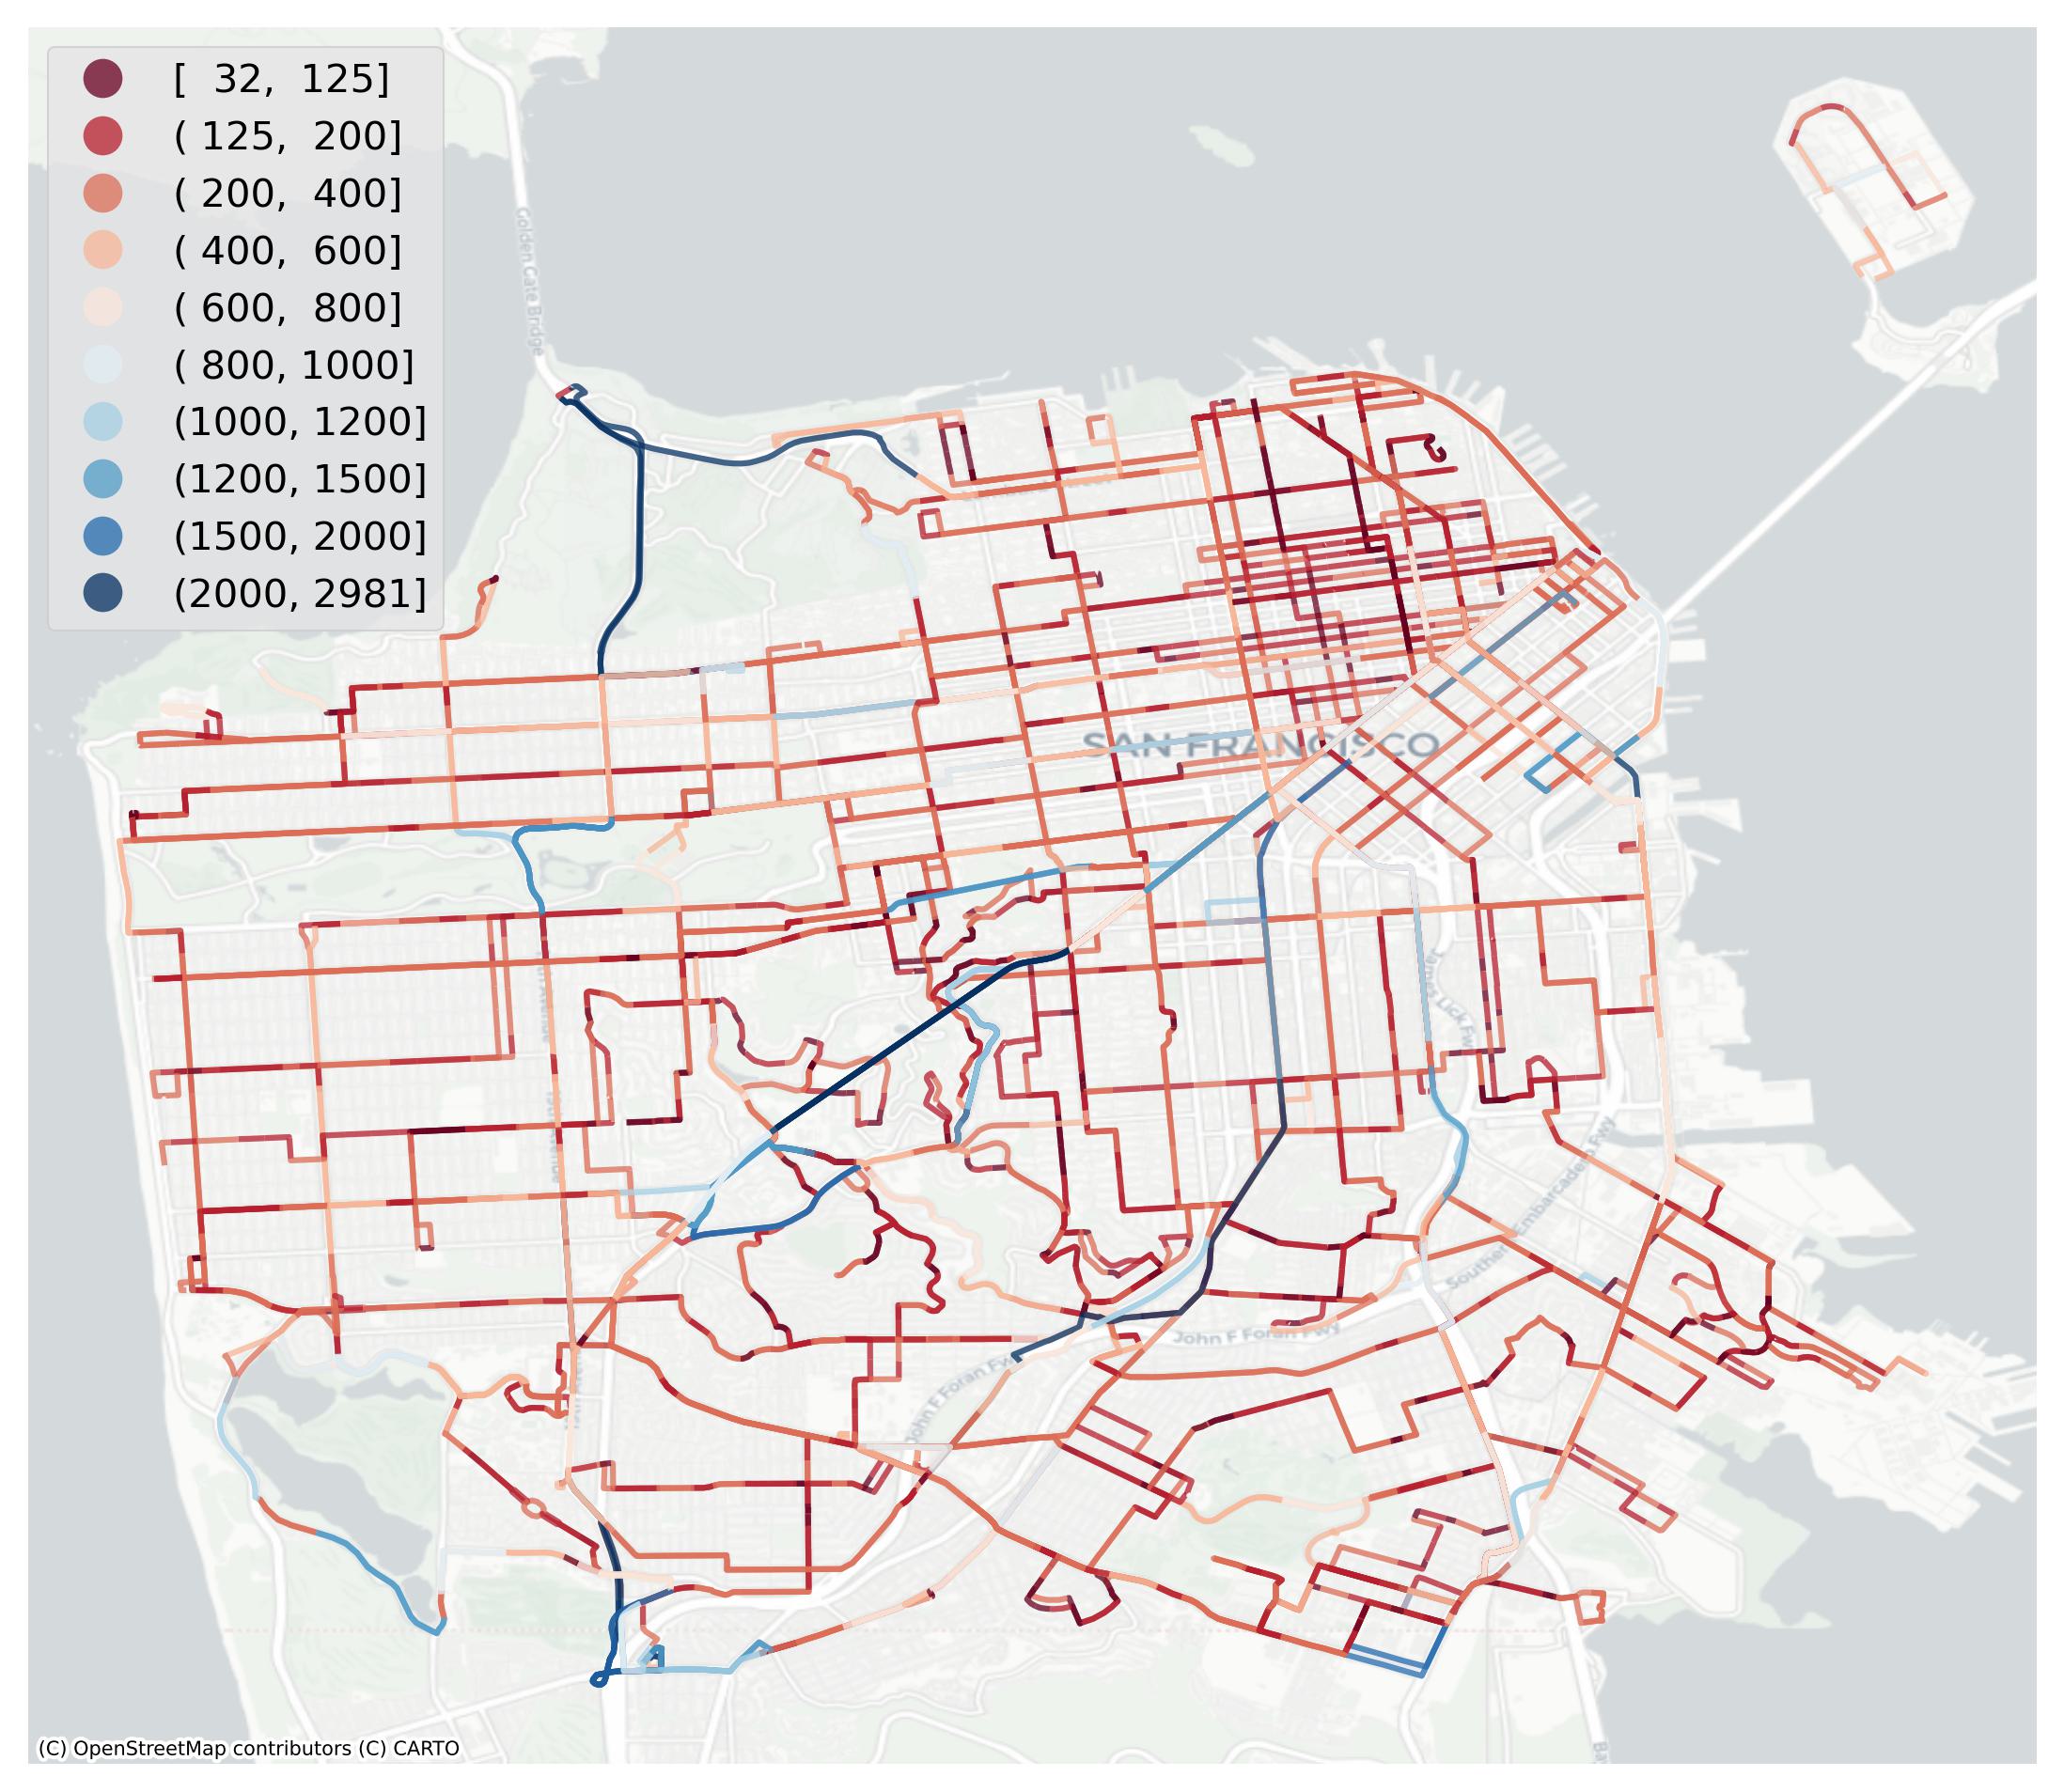
view_heatmap(df, cmap="YlOrRd", interactive=True, light_mode=False)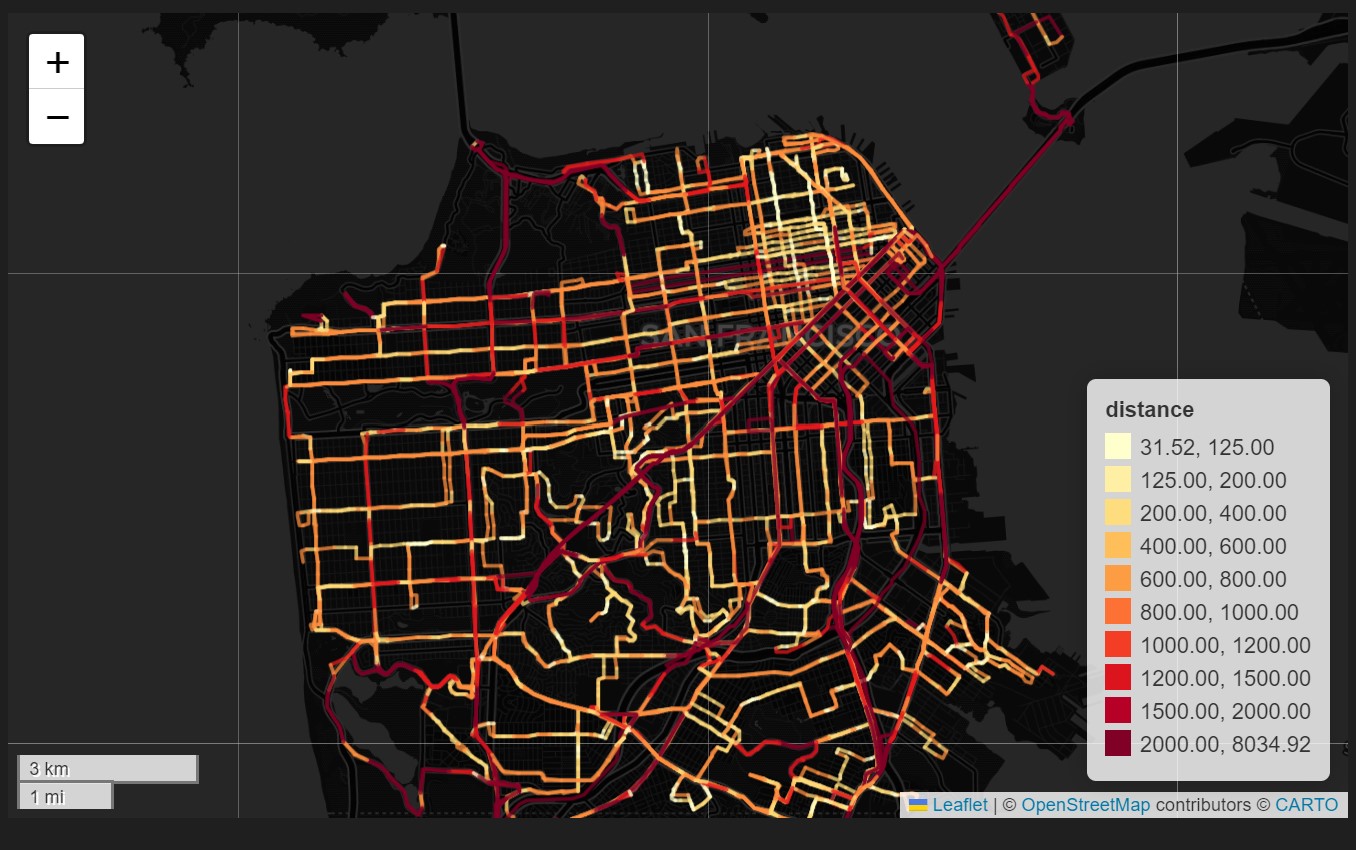
from gtfs_segments import plot_hist
plot_hist(segments_df, max_spacing = 1200)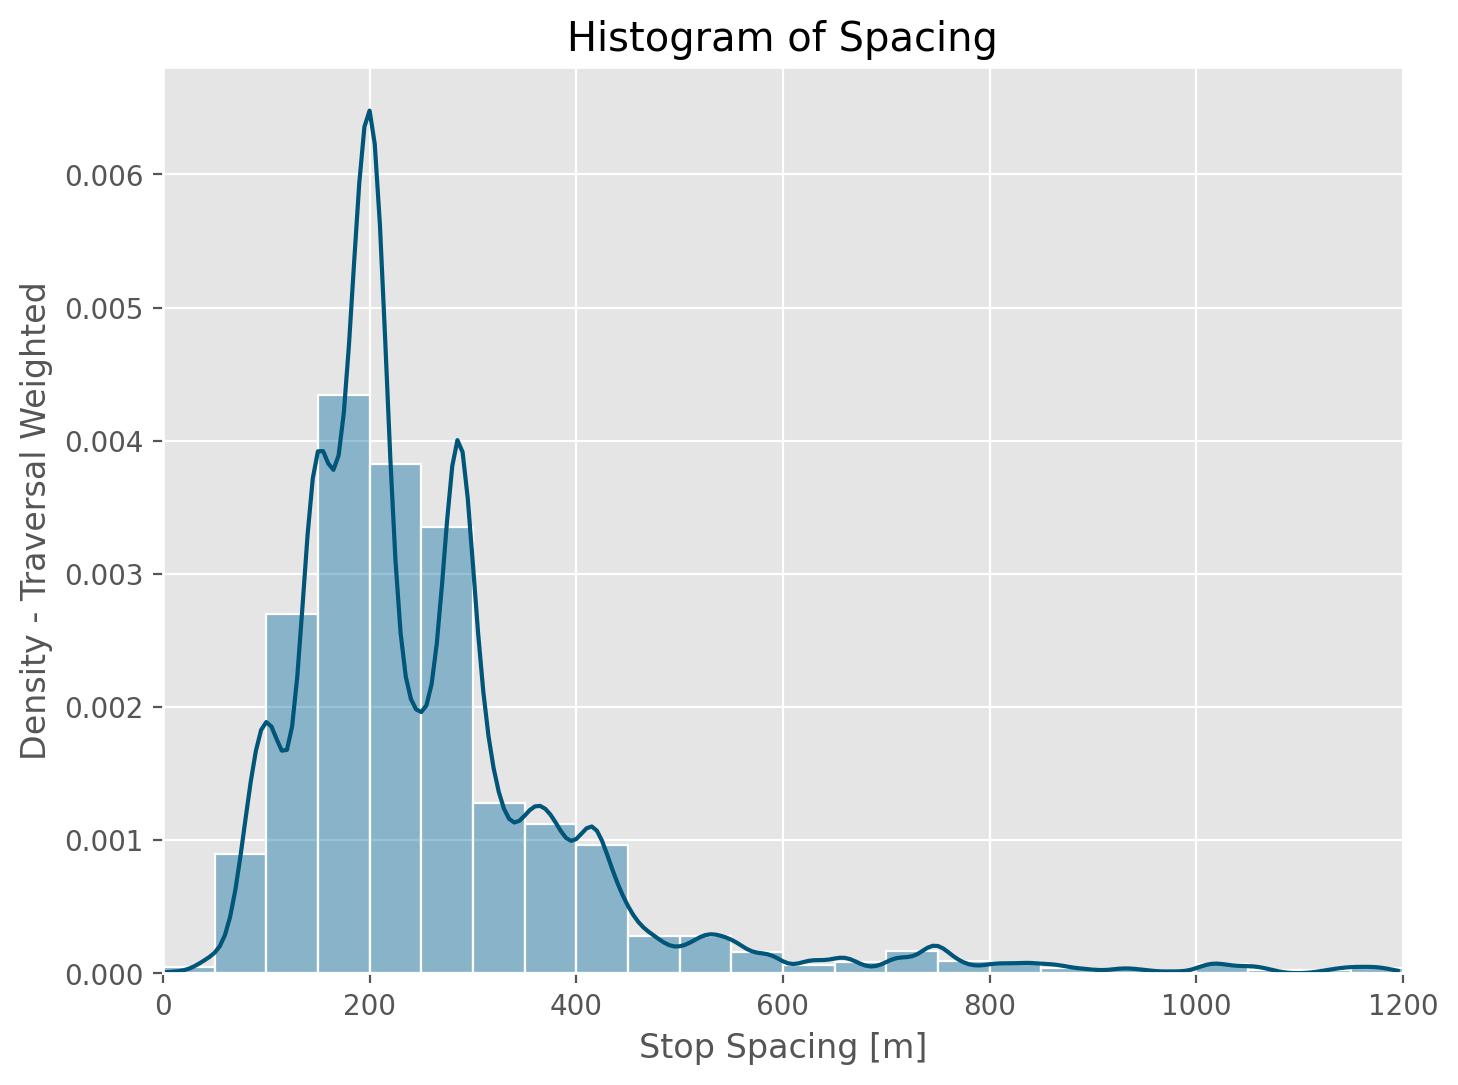
plot_hist(segments_df,file_path = "spacings_hist.png",save_fig = True)from gtfs_segments import summary_stats
summary_stats(segments_df,max_spacing = 3000,export = True,file_path = "summary.csv")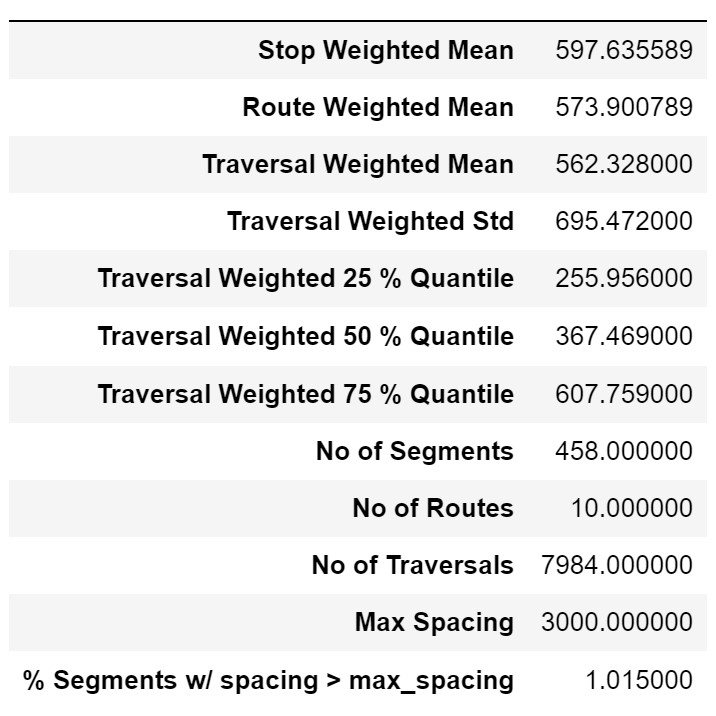
from gtfs_segments import get_route_stats,get_bus_feed
feed = get_bus_feed('path_to_gtfs.zip')
get_route_stats(feed)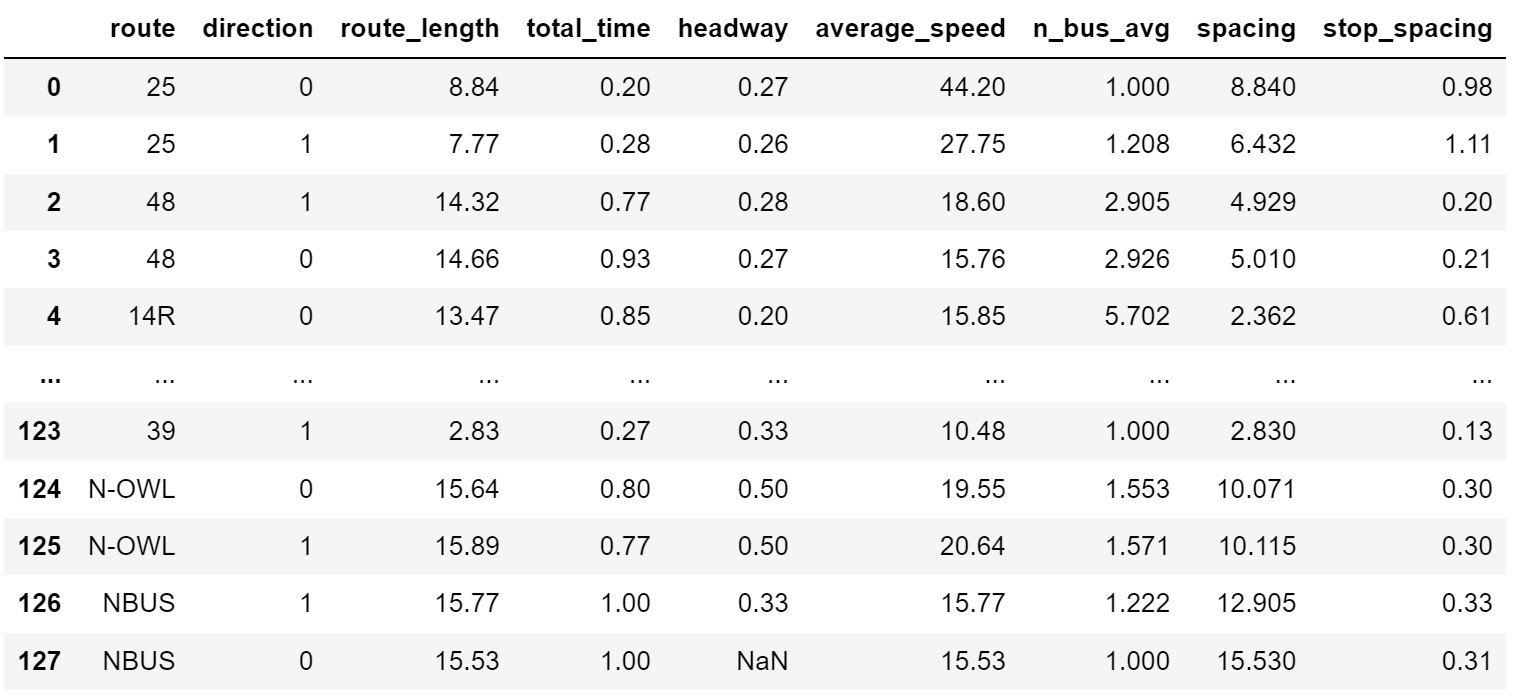
Here each row contains the following columns:
-
route: Theroute_idfor the route of interest -
direction: Thedirection_idof the route -
route_length: The total length of the route.Units: Kilometers (Km) -
total time: The total scheduled time to travel the whole route.Units: Hours (Hr) -
headway: The average headway between consecutive buses for the route. ANaNindicates only 1 trip.Units: Hours (Hr) -
peak_buses: The 15-minute interval where the route has the maximum number of buses concurrently running. -
average_speed: The average speed of the bus along the route.Units: Kmph -
n_bus_avg: The average number of buses concurrently running -
bus_spacing: The average spacing (in distance) between consecutive buses.Units:Kilometers (Km) -
stop_spacing: The average distance between two consecutive stops.Units:Kilometers (Km)
Download the data as either .csv or .geojson
from gtfs_segments import export_segments
export_segments(segments_df,'filename', output_format ='geojson')
# Get csv without geometry
export_segments(segments_df,'filename', output_format ='csv',geometry = False)- Add interactive visualization with folium
- Visualize catchment areas for stops
- Log trips that do not have shapes
See the open issues for a full list of proposed features (and known issues).
Distributed under the MIT License. See LICENSE.txt for more information.
If you use gtfs-segments in your research please use the following BibTeX entry:
@software{devunuri_gtfs_segments,
author = {Devunuri, Saipraneeth and Lehe, Lewis},
doi = {10.5281/zenodo.10019419},
month = Oct,
title = {{GTFS Segments: A fast and efficient library to generate bus stop spacings}},
url = {https://github.com/UTEL-UIUC/gtfs_segments},
version = {2.0.3},
year = {2023}
}
If you use stop spacings paper in your research please use the following BibTeX entry:
@article{Devunuri2024,
  title = {Bus Stop Spacing Statistics: {{Theory}} and Evidence},
  shorttitle = {Bus Stop Spacing Statistics},
  author = {Devunuri, Saipraneeth and Lehe, Lewis J. and Qiam, Shirin and Pandey, Ayush and Monzer, Dana},
  year = {2024},
  month = jan,
  journal = {Journal of Public Transportation},
  volume = {26},
  pages = {100083},
  issn = {1077-291X},
  doi = {10.1016/j.jpubtr.2024.100083},
  url = {https://www.sciencedirect.com/science/article/pii/S1077291X24000031},
  urldate = {2024-03-07},
  keywords = {Bus stop,GTFS,Public Transit,Stop Spacings,Transit Planning}
}Contributions are what makes the open-source community such an amazing place to learn, inspire, and create. Any contributions you make are greatly appreciated.
If you have a suggestion that would make this better, please fork the repo and create a pull request. You can also simply open an issue with the tag "enhancement". Don't forget to give the project a star! Thanks again!
- Fork the Project
- Create your Feature Branch (
git checkout -b feature/AmazingFeature) - Commit your Changes (
git commit -m 'Add some AmazingFeature') - Push to the Branch (
git push origin feature/AmazingFeature) - Open a Pull Request
For more information refer to CONTRIBUTING.md
Saipraneeth Devunuri - @praneethDevunu1 - sd37@illinois.edu
Project Link: https://github.com/UTEL-UIUC/gtfs_segments
- Parts of the code use the Partridge library
- Do check out gtfs_functions which was an inspiration for this project
- Shoutout to Mobility Data for compiling GTFS from around the globe and constantly maintaining them


![dependabot[bot]](https://avatars.githubusercontent.com/u/49699333?size=120)