Histogramy
Histogramy is a CUI program to analyze 1-dimensional data.
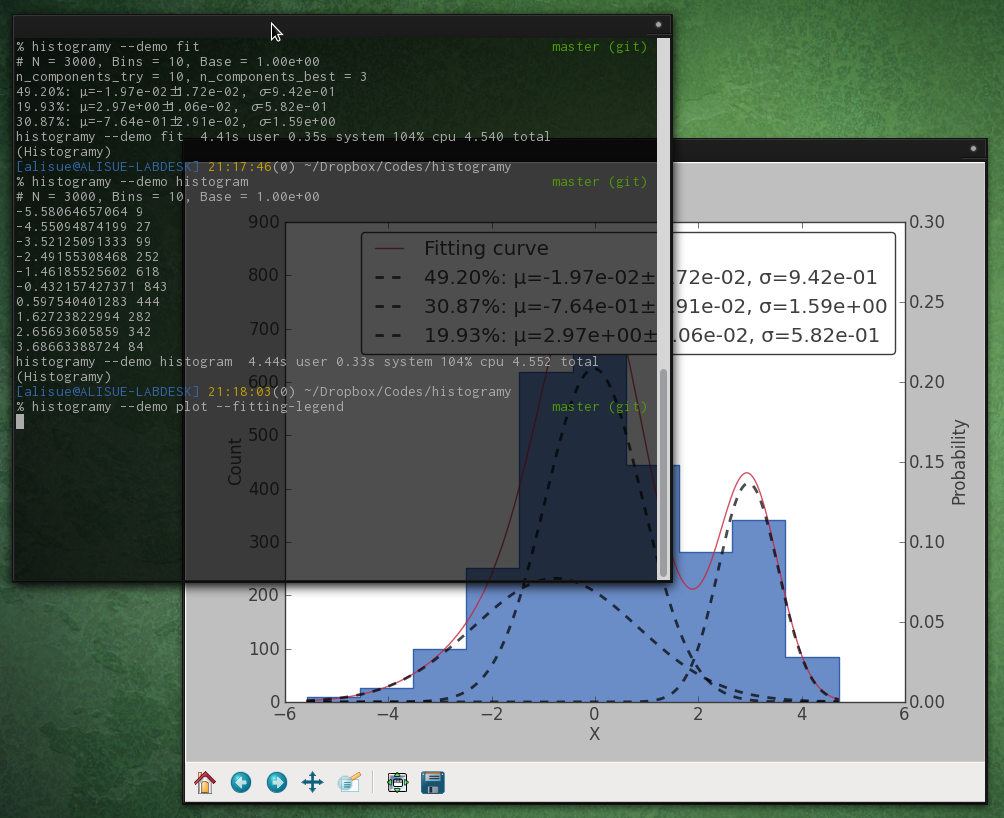
It draw a histogram with specified data and it also can draw the fitting curve estimated by a Gaussian Mixture Model probability distribution.
Requirements
Install
-
You have to install Python. Follow the instruction at http://www.python.org/getit/
-
You also have to instal numpy, and matplotlib. Follow the instructions below
-
Now, you can install Histogramy with pip or easy_install. scikit-learn will be installed automatically when you install Histogramy
-
Install pip or easy_install, follow the instrcutions below
-
Install Histogramy with the following command in Terminal (Command Prompt)
pip install histogramyor
easy_install histogramy
-
Usage
usage: histogramy [-h] [-b BINS] [-c N] [-C N] [--base BASE] [--auto-base]
                [--min-threshold MIN] [--max-threshold MAX]
                [--covariance-type TYPE] [--min-covar MIN_COVAR]
                [--delimiter DELIMITER] [--encoding ENCODING] [--demo]
                [filenames [filenames ...]] {histogram,fit,plot} ...

positional arguments:
filenames
{histogram,fit,plot}
    histogram           Show histogram data
    fit                 Show fitting data
    plot                Create graph by matplotlib

optional arguments:
-h, --help            show this help message and exit
-b BINS, --bins BINS  It defines the number of equal-width bins.
-c N, --column N      A number of column in data file used for analysis
-C N, --classifiers N
                        The maximum number classifiers to simulate the fitting
--base BASE           Base value to modulate the data
--auto-base           Automatically find the base value to modulate the data
--min-threshold MIN   Minimum threshold. Value smaller than this will be
                        ignored
--max-threshold MAX   Maximum threshold. Value grater than this will be
                        ignored
--covariance-type TYPE
                        Type of covariance. Default is "diag"
--min-covar MIN_COVAR
                        Minimum value of covariance
--delimiter DELIMITER
                        Delimiter used to parse the data file
--encoding ENCODING   Encoding used to open the data file
--demo                Use demo data to analysis
