hmmviz
A package for visualizing state transition graphs from hidden Markov models or other models.
This package is meant to serve as an out-of-the-box means of plotting small graphs (less than 10 nodes) in a customizable way.
Installation
Developed with Python 3.6
pip install hmmviz
Usage
Each graph object takes a pandas DataFrame with states indices and columns and transition probabilities (from index to column). However, these can be instantiated using different data structures such as numpy arrays, networkx graphs, etc. (help needed) via the appropriate class methods. as values.
Plotting a Transition Matrix from a Markov Process
from hmmviz import TransGraph
import pandas as pd
import matplotlib.pyplot as plt
sequence = ['sunny', 'sunny', 'rainy', 'rainy', 'sunny', 'sunny', 'sunny', 'rainy']
T = pd.crosstab(
pd.Series(sequence[:-1], name='Today'),
pd.Series(sequence[1:], name='Tomorrow'),
normalize=0
)
# Tomorrow rainy sunny
# Today
# rainy 0.5 0.5
# sunny 0.4 0.6
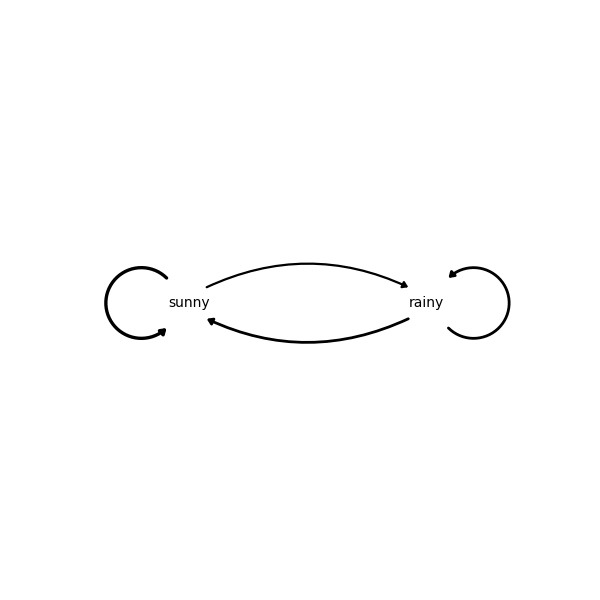
graph = TransGraph(T)
# looks best on square figures/axes
fig = plt.figure(figsize=(6, 6))
graph.draw()
plt.show()This will make an all black graph with labels on the nodes but none on the edges.
If we want to make the graph more colorful and informative we can pass some parameters into the graph's draw method.
# same T as before
graph = TransGraph(T)

fig = plt.figure(figsize=(6, 6))

nodelabels = {'sunny':  '☁☀', 'rainy': '😊☂'}
colors = {'sunny': 'orange', 'rainy': 'blue'}

graph.draw(
    nodelabels=nodelabels, nodecolors=colors, edgecolors=colors, edgelabels=True,
    nodefontsize=16,
)

plt.show()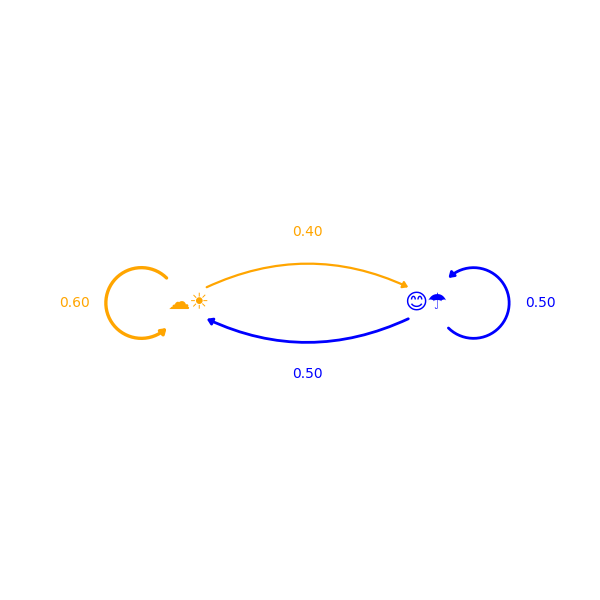
hmmviz really shines for graphs with 4 or 5 nodes. For larger graphs consider using a package like nxviz.
import numpy as np

arr = np.ones((4, 4)) * 0.25

labels = ['s0', 's1', 's2', 's3']

graph = TransGraph.from_array(arr, labels)

colors = {f's{i}': f'C{i}' for i in range(4)}

plt.figure(figsize=(6, 6))

graph.draw(edgecolors=colors, nodecolors=colors, nodelabels=False, edgewidths=2)

plt.show()

![dependabot[bot]](https://avatars.githubusercontent.com/u/49699333?size=120)