It's 2019 and this project is still actively developed.
imwatchingyou
A "live" Python debugger.
Watch your program work without stopping its operation or flow

imwatchingyou
A "live debugger". It was developed to help debug PySimpleGUI based programs, but it can be used to debug any program including non-GUI programs. PySimpleGUI is the only requirement.
With this "debugger" you can:
- Set "variable watches" that update in realtime
- Write expressions / code that update in realtime
- Use a REPL style prompt to type in "code", expressions, and modify variables
All of this is done using separate windows from your primary application.

Installation
Installation is via pip:
pip install imwatchingyou
or if you need to upgrade later:
pip install --upgrade --no-cache-dir imwatchingyou
Note that you MUST install the debugger using pip rather than downloading. It depends on other packages and the pip install will make sure they are installed properly.
So, don't forget: You must pip install imwatchingyou in order to use it.
Integrating imwatchingyou Into Your Application
There are 3 lines of code to add to a program in order to make it debugger ready - The import, a "show debugger window" call, and a "refresh debugger windows" call.
Integrating with a Non-GUI Application
It's your application's job to periodically call a "refresh" function. The more frequently you call the refresh, the more quickly your commands/actions will be executed. If you refresh once a second, then it could be
import imwatchingyou
import time

# imwatchingyou.show_debugger_window()    # Uncomment if you want to immediately display the debug window

counter = 0     # Some variable for you to watch / changing
# Using a loop in order to call the debugger refresh function on a periodic basis
while True:
    imwatchingyou.refresh_debugger()
    time.sleep(.1)          # Simulating doing a bunch of work
    # Using the counter to trigger the debug window display. You can use something else as your trigger.
    if counter == 20:
        imwatchingyou.show_debugger_window()
    # do something with a variable that we can see/modify
    print(counter)
    counter += 1
Integrating with a PySimpleGUI Based Program
You can use imwatchingyou with any of the PySimpleGUI ports. The only requirement is that you call the refresh function periodically. Adding it to your PySimpleGUI event loop is a good way of doing that. Make sure you are not blocking on your Window.read() calls by adding a timeout.
Here is an entire program that is debugged using imwatchingyou:
import PySimpleGUI as sg
# import PySimpleGUIQt as sg        # can use with the Qt port too
import imwatchingyou  # STEP 1

"""
    Demo program that shows you how to integrate the PySimpleGUI Debugger
    into your program.
    This particular program is a GUI based program simply to make it easier for you to interact and change
    things.

    In this example, the debugger is not started initiallly. You click the "Debug" button to launch it
    There are THREE steps, and they are copy and pastes.
    1. At the top of your app to debug add
            import imwatchingyou
    2. When you want to show a debug window, call one of two functions:
        imwatchingyou.show_debug_window()
        imwatchingyou.show_popout_window()
    3. You must find a location in your code to "refresh" the debugger.  Some loop that's executed often.
        In this loop add this call:
        imwatchingyou.refresh()
"""
sg.change_look_and_feel('BlueMono')
layout = [
    [sg.T('A typical PSG application')],
    [sg.In(key='_IN_')],
    [sg.T('        ', key='_OUT_', size=(30, 1))],
    [sg.Radio('a', 1, key='_R1_'), sg.Radio('b', 1, key='_R2_'), sg.Radio('c', 1, key='_R3_')],
    [sg.Combo(['c1', 'c2', 'c3'], size=(6, 3), key='_COMBO_')],
    [sg.Output(size=(50, 6))],
    [sg.Ok(), sg.Exit(), sg.Button('Debug'), sg.Button('Popout')],
]

window = sg.Window('This is your Application Window', layout)

counter = 0
timeout = 100

while True:  # Your Event Loop
    event, values = window.read(timeout=timeout)
    if event in (None, 'Exit'):
        break
    elif event == 'Ok':
        print('You clicked Ok.... this is where print output goes')
    elif event == 'Debug':
        imwatchingyou.show_debugger_window()  # STEP 2
    elif event == 'Popout':
        imwatchingyou.show_debugger_popout_window()  # STEP 2
    counter += 1
    # to prove window is operating, show the input in another area in the window.
    window['_OUT_'].update(values['_IN_'])

    # don't worry about the "state" of things, just call this function "frequently"
    imwatchingyou.refresh_debugger()  # STEP 3 - refresh debugger

window.close()
Showing the debugger
There are 2 primary GUI windows the debugger has to show.
The Primary Debug Window
The main debug window is displayed by calling:
imwatchingyou.show_debugger_window()
This will display the Primary / Main Debug Window, starting on its "Variables" Tab. The main debug window has 2 tabs one for variable watches the other for REPL and expression watches.
Variables Tab

Like all of the imwatchingyou debugger windows, this window is refreshed every time your application calls the refresh function imwatchingyou.refresh_debugger()
Here you can see up to 8 of your variables and one custom expression. You select which of your variables to see using the "Choose Variables To Auto Watch" buttton. This will bring up this selection window:
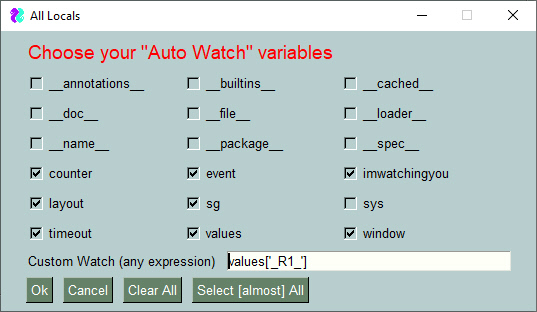
Use this window to check the variables you want to "watch" on the debug screen. This is also where you type in your custom watch.
REPL Tab
The is the REPL portion of the debugger You can also examine objects in detail on this page using the "Obj" button. This feature is currently broken / crippled. Will be turning attention to it shortly

Popout Debug Window
The "Popout Debug Window" is the small "Popout" window that floats on top of your other windows and is located in the upper right corner of your display.

Note that this popout window is created in the upper right corner of your screen.
If you right click this window's text (anything that is text), you'll bring up the right click menu which can be used to close the window or to open the main debug window.

This Popout window is displayed in either of these 2 manners:
- by clicking the "Popout" button from the Main Debug Window
- by calling
imwatchingyou.show_debugger_popout_window()
Refreshing the debugger
The most important call you need to make is a imwatchingyou.refresh() call.
If debugginer a PySimpleGUI based application, this "refresh" call that must be added to your event loop. Your window.Read call should have a timeout value so that it does not block. If you do not have a timeout value, the debugger will not update in realtime.
If you are debugging a non-PySimpleGUI program, no problem, just put this call somewhere that it will be called several times a second. Or say once a second at minimum. This frequency will determine how quickly the variable values will change in your debug windows.
Add this line to the top of your event loop:
imwatchingyou.refresh_debugger()
Accessing the debugger windows
Your task is to devise a way for your appliction to call the needed 2 or 3 functions.
If you're making a GUI program, then make a hotkey or a button that will call imwatchingyou.show_debugger_window() and you're off to the races! You can use the main debugger window to launch the smaller "Popout" variable window.
Or maybe call imwatchingyou.show_debugger_popout_window() after the action gets started in your program and then forget about it, glancing up at the window in the corner of your desktop for the current values of all your variables.
The Future
Have been working on a version that is integrated direcetly into PySimpleGUI itself (only the tktiner version) that is not officially up and running.
Release Notes
imwatchingyou 1.1 26-May-2019
- Addition of "Code" line so that things like "import os" can be run from the repl
imwatchingyou 1.2.1 27-May-2019
- Can press ENTER for both REPL fields and it'll execute them! NICE
- Code cleanup
- STILL under 200 lines of code! WITH a GUI.
imwatchingyou 1.3.0 27-May-2019
- New "Auto Watcher" feature
- New viewing area for these variables
- Chosen using a page of checkboxes
- Other cool shit that I can't recall. Was up coding all night
- Up to 250 lines of code in total, but I've been extremely inefficient. Can be compacted quite a bit. I went for readability for now.
- Still the only 250 lines of Python code, real-time, GUI, watcher with REPL that you'll find anywhere
imwatchingyou 1.4.1 27-May-2019
- Forgot release notes
imwatchingyou 1.5.0 28-May-2019
- Lots of nice code cleanup
- Rework of auto-watching
- Clear capability in 2 places
- Can cancel out of choosing to make changes
- Confirmation when choosing to clear auto-watches in main interface
- Choose autowatches now has a "real event loop"... it also means it BLOCKS waiting on your choices
- Shows non-blocking, "Message" when clearing checkboxes
imwatchingyou 1.6.0 28-May-2019
- No more globals! Cheating and using a class instead. Same diff
- Working of all interfaces is the best way to sum it up
- there are 45 differences that I don't feel like listing
- lots of shit changed
imwatchingyou 1.7.0 28-May-2019
- User interface change - expect lots of those ahead. This was a good enough one to make a new release
- Nice selection interface for auto display
- Next is to create a tiny version of this output that is a floating, tiny window
imwatchingyou 2.0.0 29-May-2019
Why 2.0? So soon? Well, yea. Been working my ass off on this project and a LOT has happened in a short period of time. Major new functionality AND it breaks the APIs badly. That was a major reason for 2.0. Completely different set of calls.
- There are now 3 and only 3 user callable functions:
imwatchingyou.show_debug_window()imwatchingyou.show_popout_window()imwatchingyou.refresh()
- These functions can be called in any order. You do not have to show a window prior to refreshing
- All of the initializing and state handling are handled for you behind the scenes, making it trivial for you to add to your code.
- The famous "Red X" added to this program too
- Changed user interfaces in a big way
- Experimenting with a "Paned" main intrterface
- It really paned me to do it this way
- Perhaps tabs will be better in the future?
- It looks pretty bitching
- It makes this code COMPLETELY un-portable to other PySimpleGUI ports
- This is another reason tabs are a better choice
- Lots of large letter comments
- New "Auto choose" features that will choose variables to watch for you
- New "Clear" features
- New PopOut window!!
- Displays in the upper right corner of your display automatially - perhaps can move in the future releases
- Stays on top always
- Can be used with or without main debugger window
- Can be easily shown with
imwatchingyou.show_popout_window()
- Every call to
refresh()will automatically refresh the list of available varaiables along with the values
imwatchingyou 2.1.0 - 01-June-2019
- TONS of changes
- Mostly centered around the use of Debugger class
- Different features than in the built-in version.
- Need to continue to make changes so that the exact same code can be used by PySimpleGUI itself for the internal debugger. This will enable a copy and paste.
- Over 60 changes in this release.... let's all keep our fingers crossed
imwatchingyou 2.2.2 - 09-June-2019
- Hopefully the "last" release for a while
- Changed floating to 4 lines max per variable
- Changed to 9 auto watches
- Starts debug window with all locals chosen that don't start with _
- Removed the fullname function
- Added comments
- Moved the
debugsole global variable into a class variable - Automatically create the debug class instance when any show or refresh call is made (no init needed!)
Design
Author
Mike B.
License
GNU Lesser General Public License (LGPL 3) +

