
History plot for Keras model training
Plots training losses and metrics in Jupyter while training your keras model.
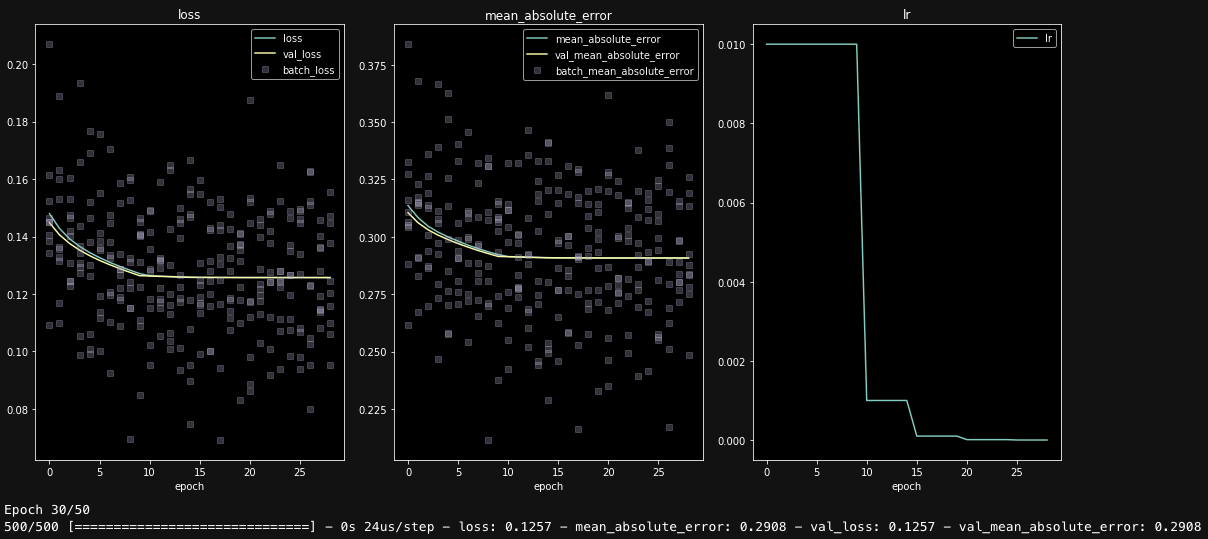
This project started as an attempt to extend livelossplot, but I realized that a rewrite was easier. Key improvements are:
- keeps full history, including losses for each batch in each epoch
- plots scatter of batch losses
- plots arbitrary log entries, such a
lr(learning rate) - simplifies codebase extendibility
Basic Usage
Install package from source:
pip install git+https://github.com/ig248/kerashistoryplot
Or from PyPi:
pip install kerashistoryplot
Import function:
from livehistoryplot.callbacks import PlotHistoryUse in callbacks:
model.fit(
    X, y,
    epochs=20,
    callbacks=[
        ReduceLROnPlateau(),
        PlotHistory(batches=True, n_cols=3, figsize=(15, 7))
    ]
)
More Examples
See notebooks/
Tests
Run
make dev-install
make test
References
Original livelossplot: https://github.com/stared/livelossplot
