metalog
Sergey Kim, Reidar Brumer Bratvold
Metalog Distribution
The metalog distributions constitute a new system of continuous univariate probability distributions designed for flexibility, simplicity, and ease/speed of use in practice. The system is comprised of unbounded, semi-bounded, and bounded distributions, each of which offers nearly unlimited shape flexibility compared to Pearson, Johnson, and other traditional systems of distributions.
The following paper and website provide a full background of the metalog distribution.
Using the Package
This Python package was transfered from RMetalog package by Isaac J. Faber and therefore shares the same R-based structure.
The package requires the following packages: numpy, pandas, matplotlib and scipy (ver 1.3.1).
The data used for demonstration are body length of salmon and were collected in 2008-2010:
import numpy as np
import pandas as pd

salmon = pd.read_csv("Chinook and forage fish lengths.csv")

# Filtered data for eelgrass vegetation and chinook salmon
salmon = salmon[(salmon['Vegetation'] == 'Eelgrass') & (salmon['Species'] == 'Chinook_salmon')]
salmon = np.array(salmon['Length'])
To import package with metalog distribution run the code:
from metalog import metalog
To fit the data to metalog distribution one should use function metalog.fit(). It has the following arguments:
-
x: data. -
bounds: bounds of metalog distribution. Depending onboundednessargument can take zero, one or two values. -
boundedness: boundedness of metalog distribution. Can take values'u'for unbounded,'sl'for semi-bounded lower,'su'for semi-bounded upper and'b'for bounded on both sides. -
term_limit: maximum number of terms to specify the metalog distribution. Can take values from 3 to 30. -
term_lower_bound: the lowest number of terms to specify the metalog distribution. Must be greater or equal to 2 and less thanterm_limit. The argument is optional. Default value is 2. -
step_len: size of steps to summarize the distribution. The argument is optional. Default value is 0.01. -
probs: probabilities corresponding to data. The argument is optional. Default value isnumpy.nan. -
fit_method: fit method'OLS','LP'or'any'. The argument is optional. Default value is'any'. -
save_data: ifTruethen data will be saved for future update. The argument is optional. Default values isFalse.
Fit metalog distribution to data and store the result to variable salmon_metalog. The distribution is bounded on both sides: from 0 to 200. Term limit is set to 10:
metalog_salmon = metalog.fit(x=salmon, boundedness='b', bounds=[0, 200], term_limit=10)
To get summary of distribution call the following function with only one argument m - the variable that stores fitted metalog distribution:
metalog.summary(m=metalog_salmon)
Output:
 -----------------------------------------------
 SUMMARY OF METALOG DISTRIBUTION OBJECT
 -----------------------------------------------

PARAMETERS

 Term Limit:  10
 Term Lower Bound:  2
 Boundedness:  b
 Bounds (only used based on boundedness):  [0, 200]
 Step Length for Distribution Summary:  0.01
 Method Use for Fitting:  any
 Number of Data Points Used:  138
 Original Data Saved:  False


VALIDATION AND FIT METHOD

     term valid method
2      2   yes    OLS
3      3   yes    OLS
4      4   yes    OLS
5      5   yes    OLS
6      6   yes    OLS
7      7   yes    OLS
8      8   yes    OLS
9      9   yes    OLS
10    10   yes    OLS
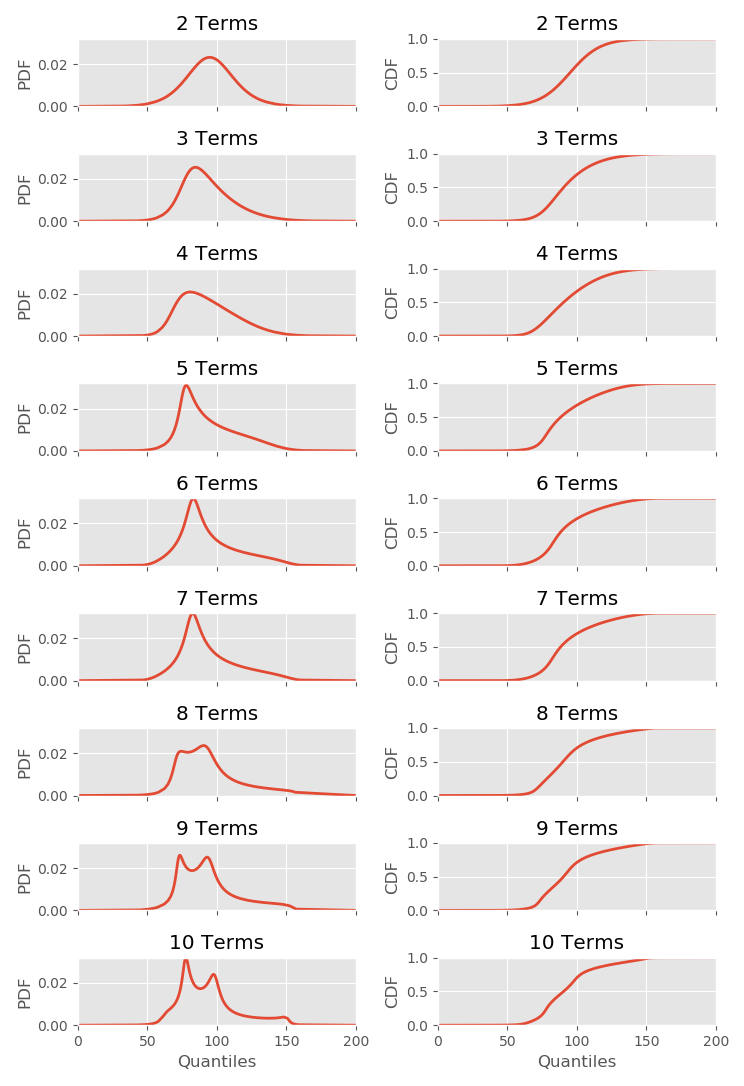
It's possible to plot corresponding PDF and CDF of metalog distribution:
metalog.plot(m=metalog_salmon)
Output:
To draw samples from distribution use metalog.r() function where n is number of samples and term specifies the terms of distribution to sample from:
metalog.r(m=metalog_salmon, n=5, term=10)
Output:
array([73.81897286, 86.74055734, 84.22509619, 83.80426247, 97.79800677])
To get densities based on quantiles type metalog.d() function where q is vector of quantiles:
metalog.d(m=metalog_salmon, q=[50, 110, 150], term=10)
Output:
array([0.00038265, 0.00712032, 0.00373991])
To calculate probabilities based on quantiles use metalog.p() function:
metalog.p(m=metalog_salmon, q=[50, 110, 150], term=10)
Output:
array([0.00275336, 0.82349578, 0.98686581])
Finally, to get quantiles from probabilites input metalog.q():
metalog.q(m=metalog_salmon, y=[0.00275336, 0.82349578, 0.98686581], term=10)
Output:
array([ 50.02583336, 109.99861143, 149.99737059])
