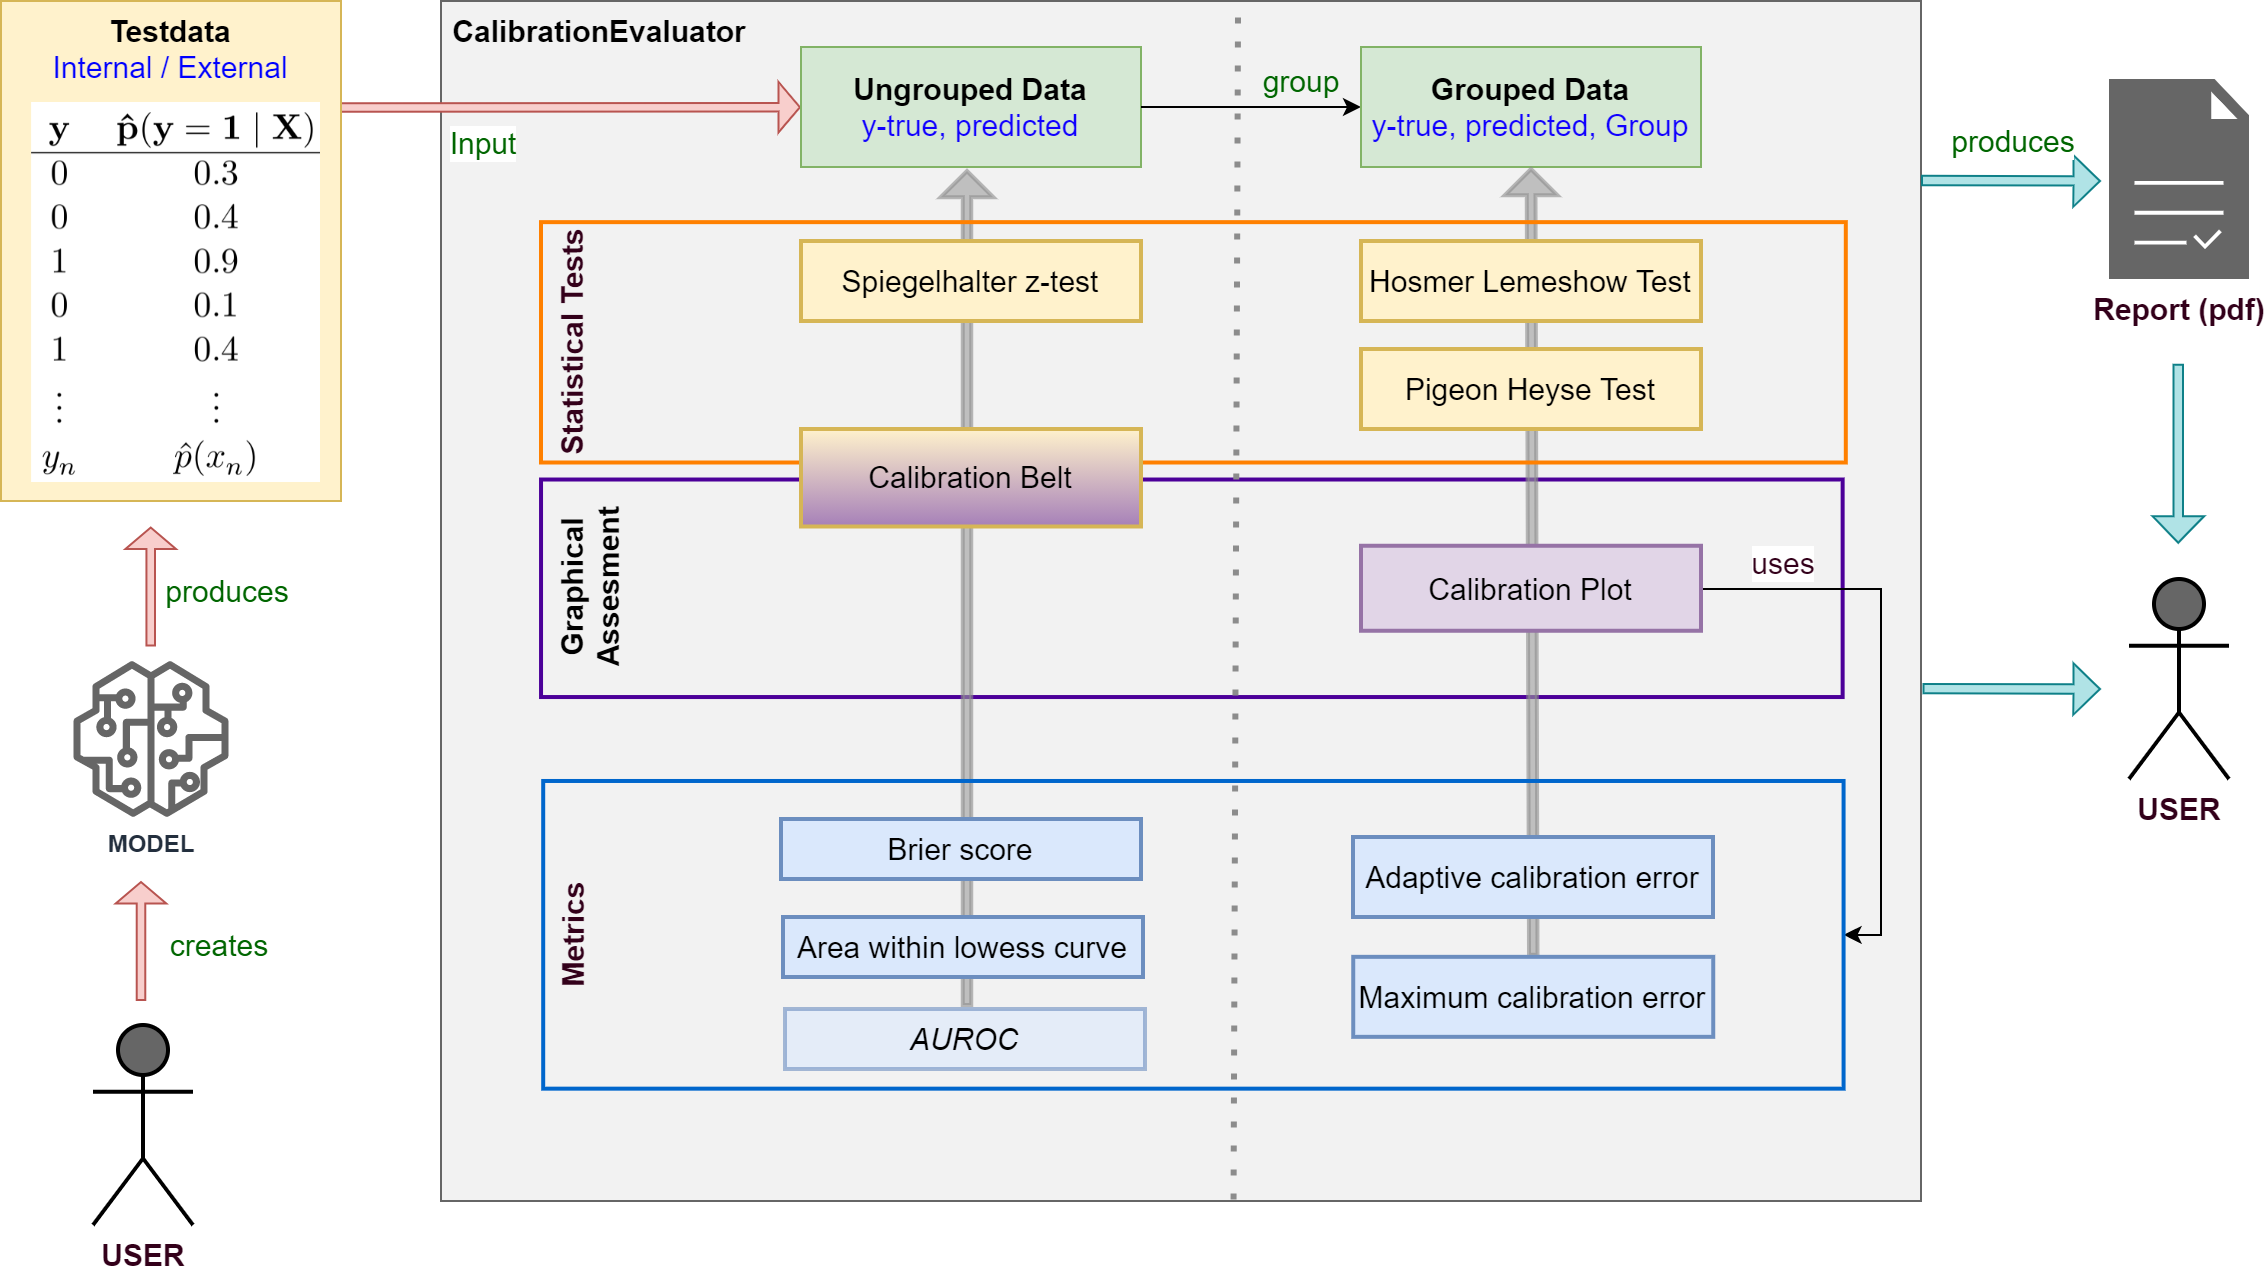
A framework for calibration evaluation of binary classification models.
When performing classification tasks you sometimes want to obtain the probability of a class label instead of the class label itself. For example, it might be interesting to determine the risk of cancer for a patient. It is desireable to have a calibrated model which delivers predicted probabilities very close to the actual class membership probabilities. For this reason, this framework was developed allowing users to measure the calibration of binary classification models.
- Evaluate the calibration of binary classification models with probabilistic output (LogisticRegression, SVM, NeuronalNets ...).
- Apply your model to testdata and use true class labels and predicted probabilities as input for the framework.
- Various statistical tests, metrics and plots are available.
- Supports creating a calibration report in pdf-format for your model.
See the documentation for detailed information about classes and methods.
Installation
$ pip install pycaleva
or build on your own
$ git clone https://github.com/MartinWeigl/pycaleva.git
$ cd pycaleva
$ python setup.py install
Requirements
- numpy>=1.17
- scipy>=1.3
- matplotlib>=3.1
- tqdm>=4.40
- pandas>=1.3.0
- statsmodels>=0.13.1
- fpdf2>=2.5.0
- ipython>=7.30.1
Usage
- Import and initialize
from pycaleva import CalibrationEvaluator
ce = CalibrationEvaluator(y_test, pred_prob, outsample=True, n_groups='auto')
- Apply statistical tests
ce.hosmerlemeshow()     # Hosmer Lemeshow Test
ce.pigeonheyse()        # Pigeon Heyse Test
ce.z_test()             # Spiegelhalter z-Test
ce.calbelt(plot=False)  # Calibrationi Belt (Test only)
- Show calibration plot
ce.calibration_plot()
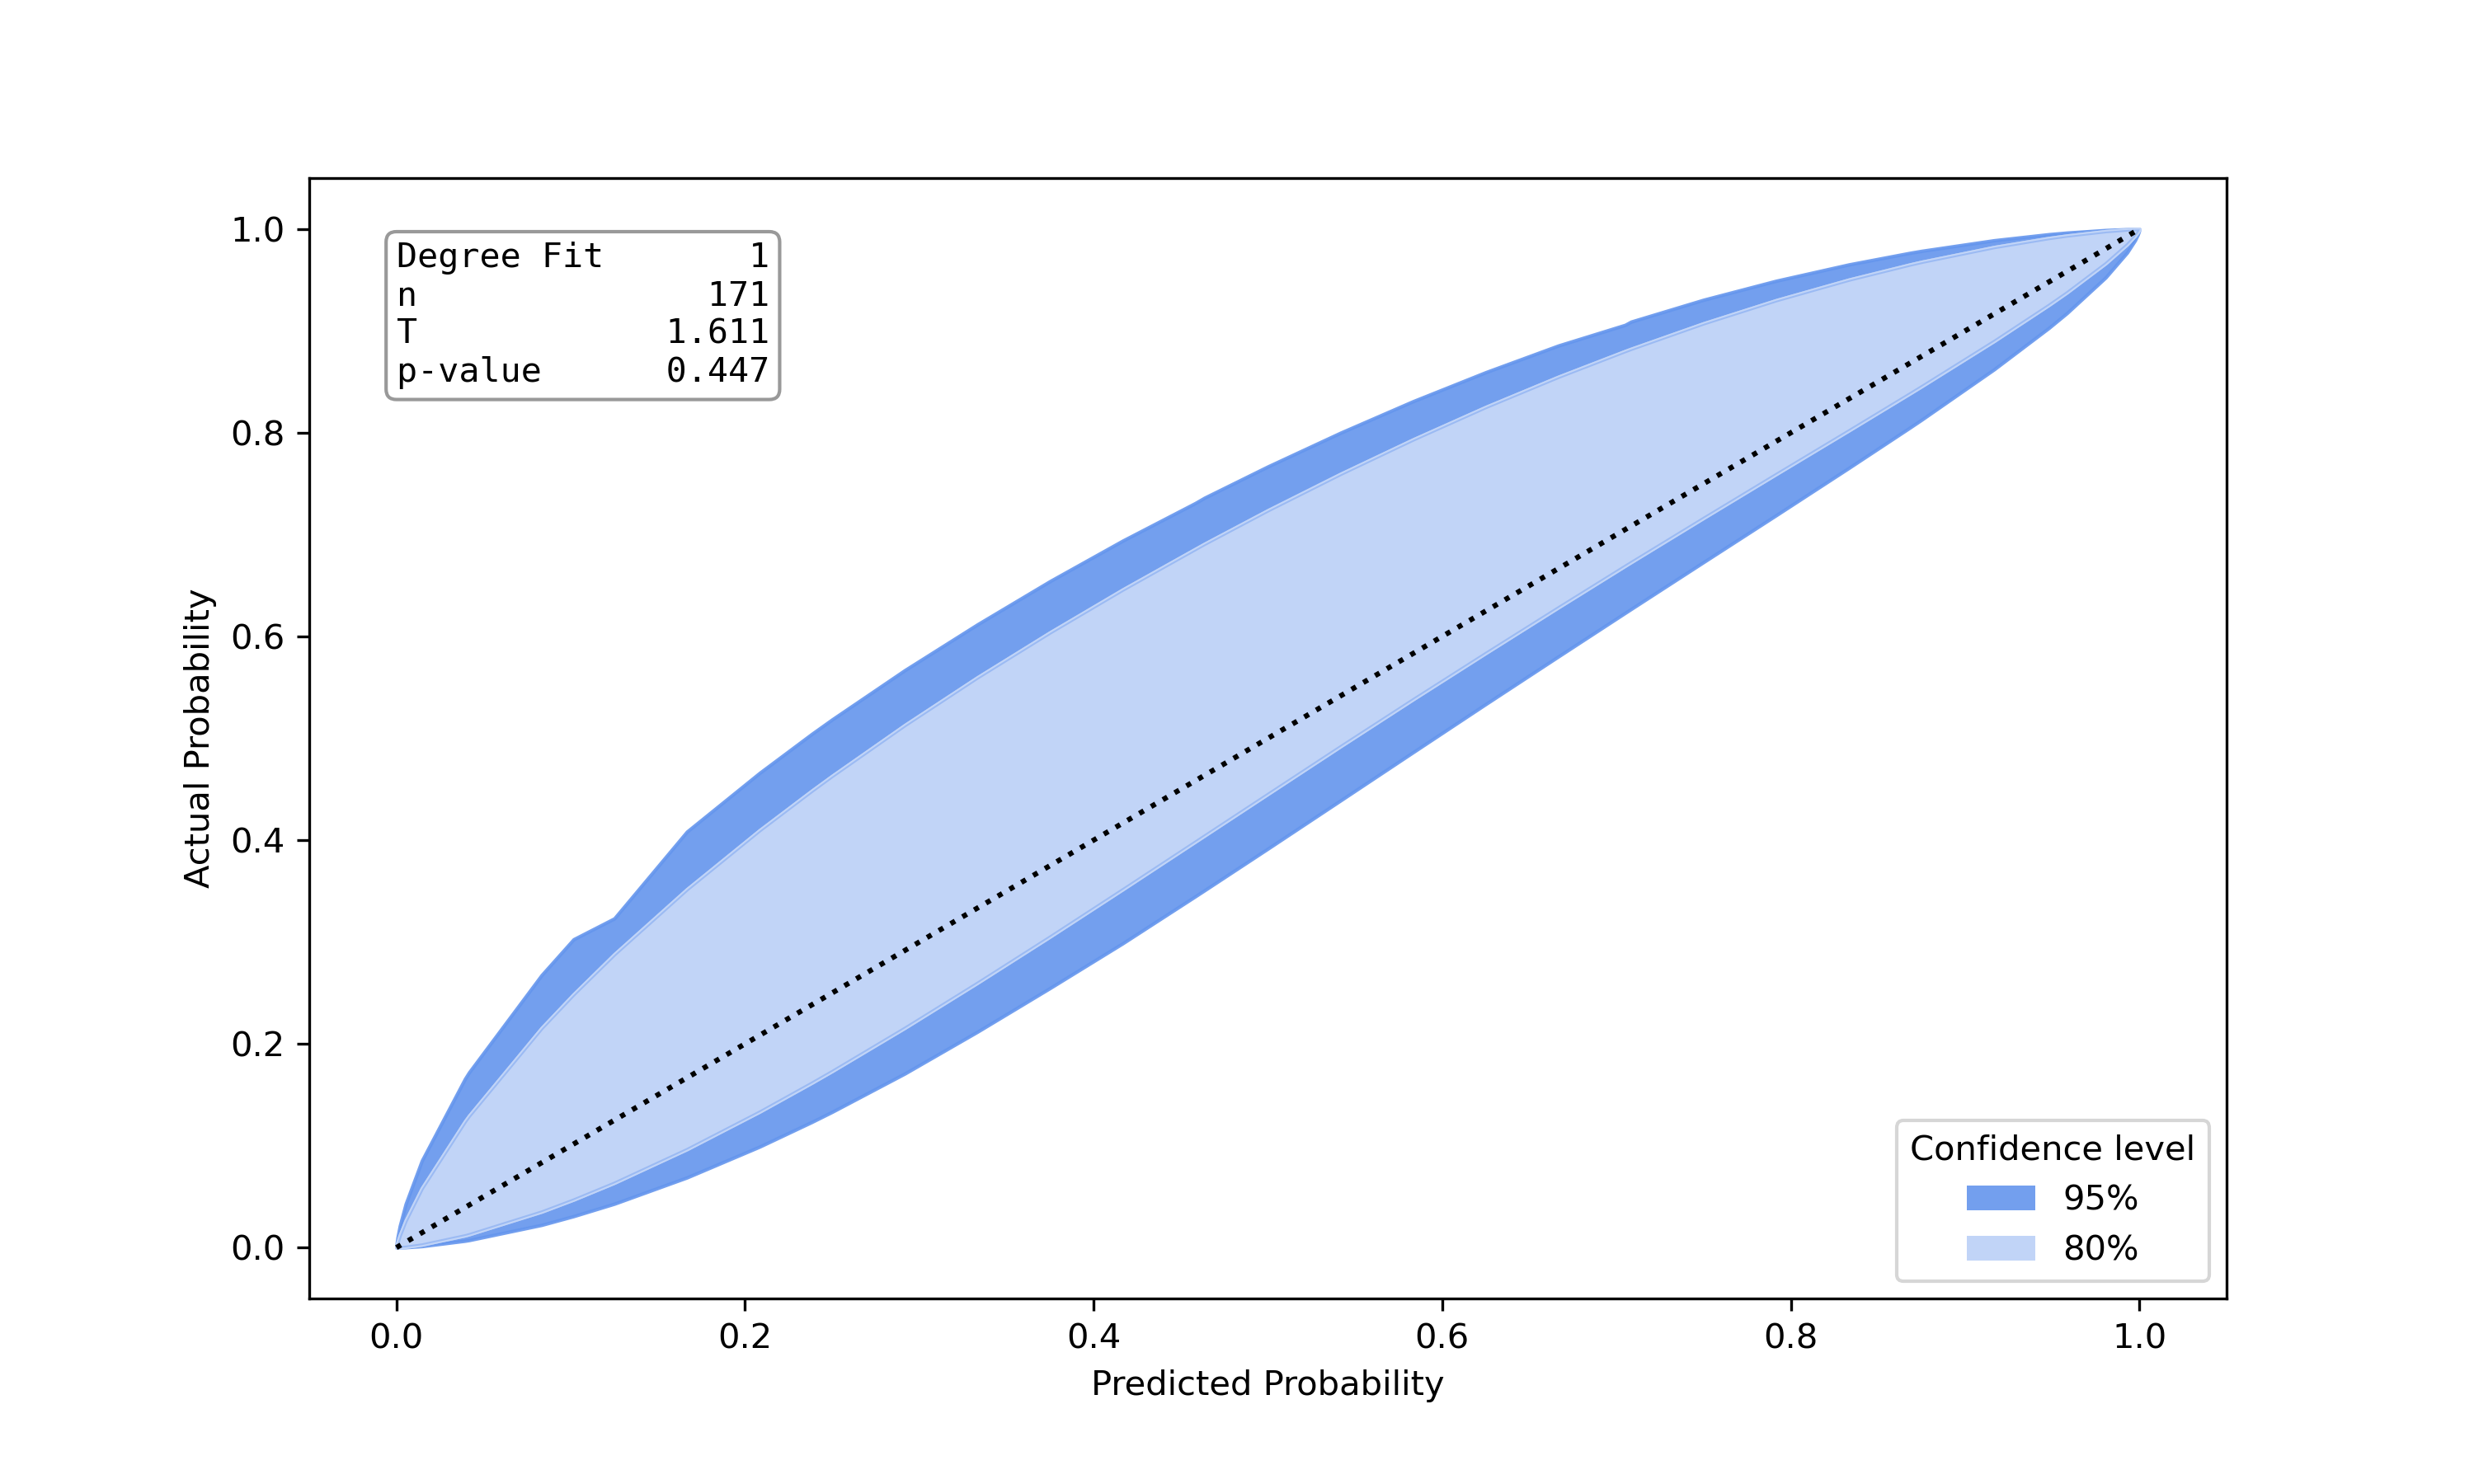
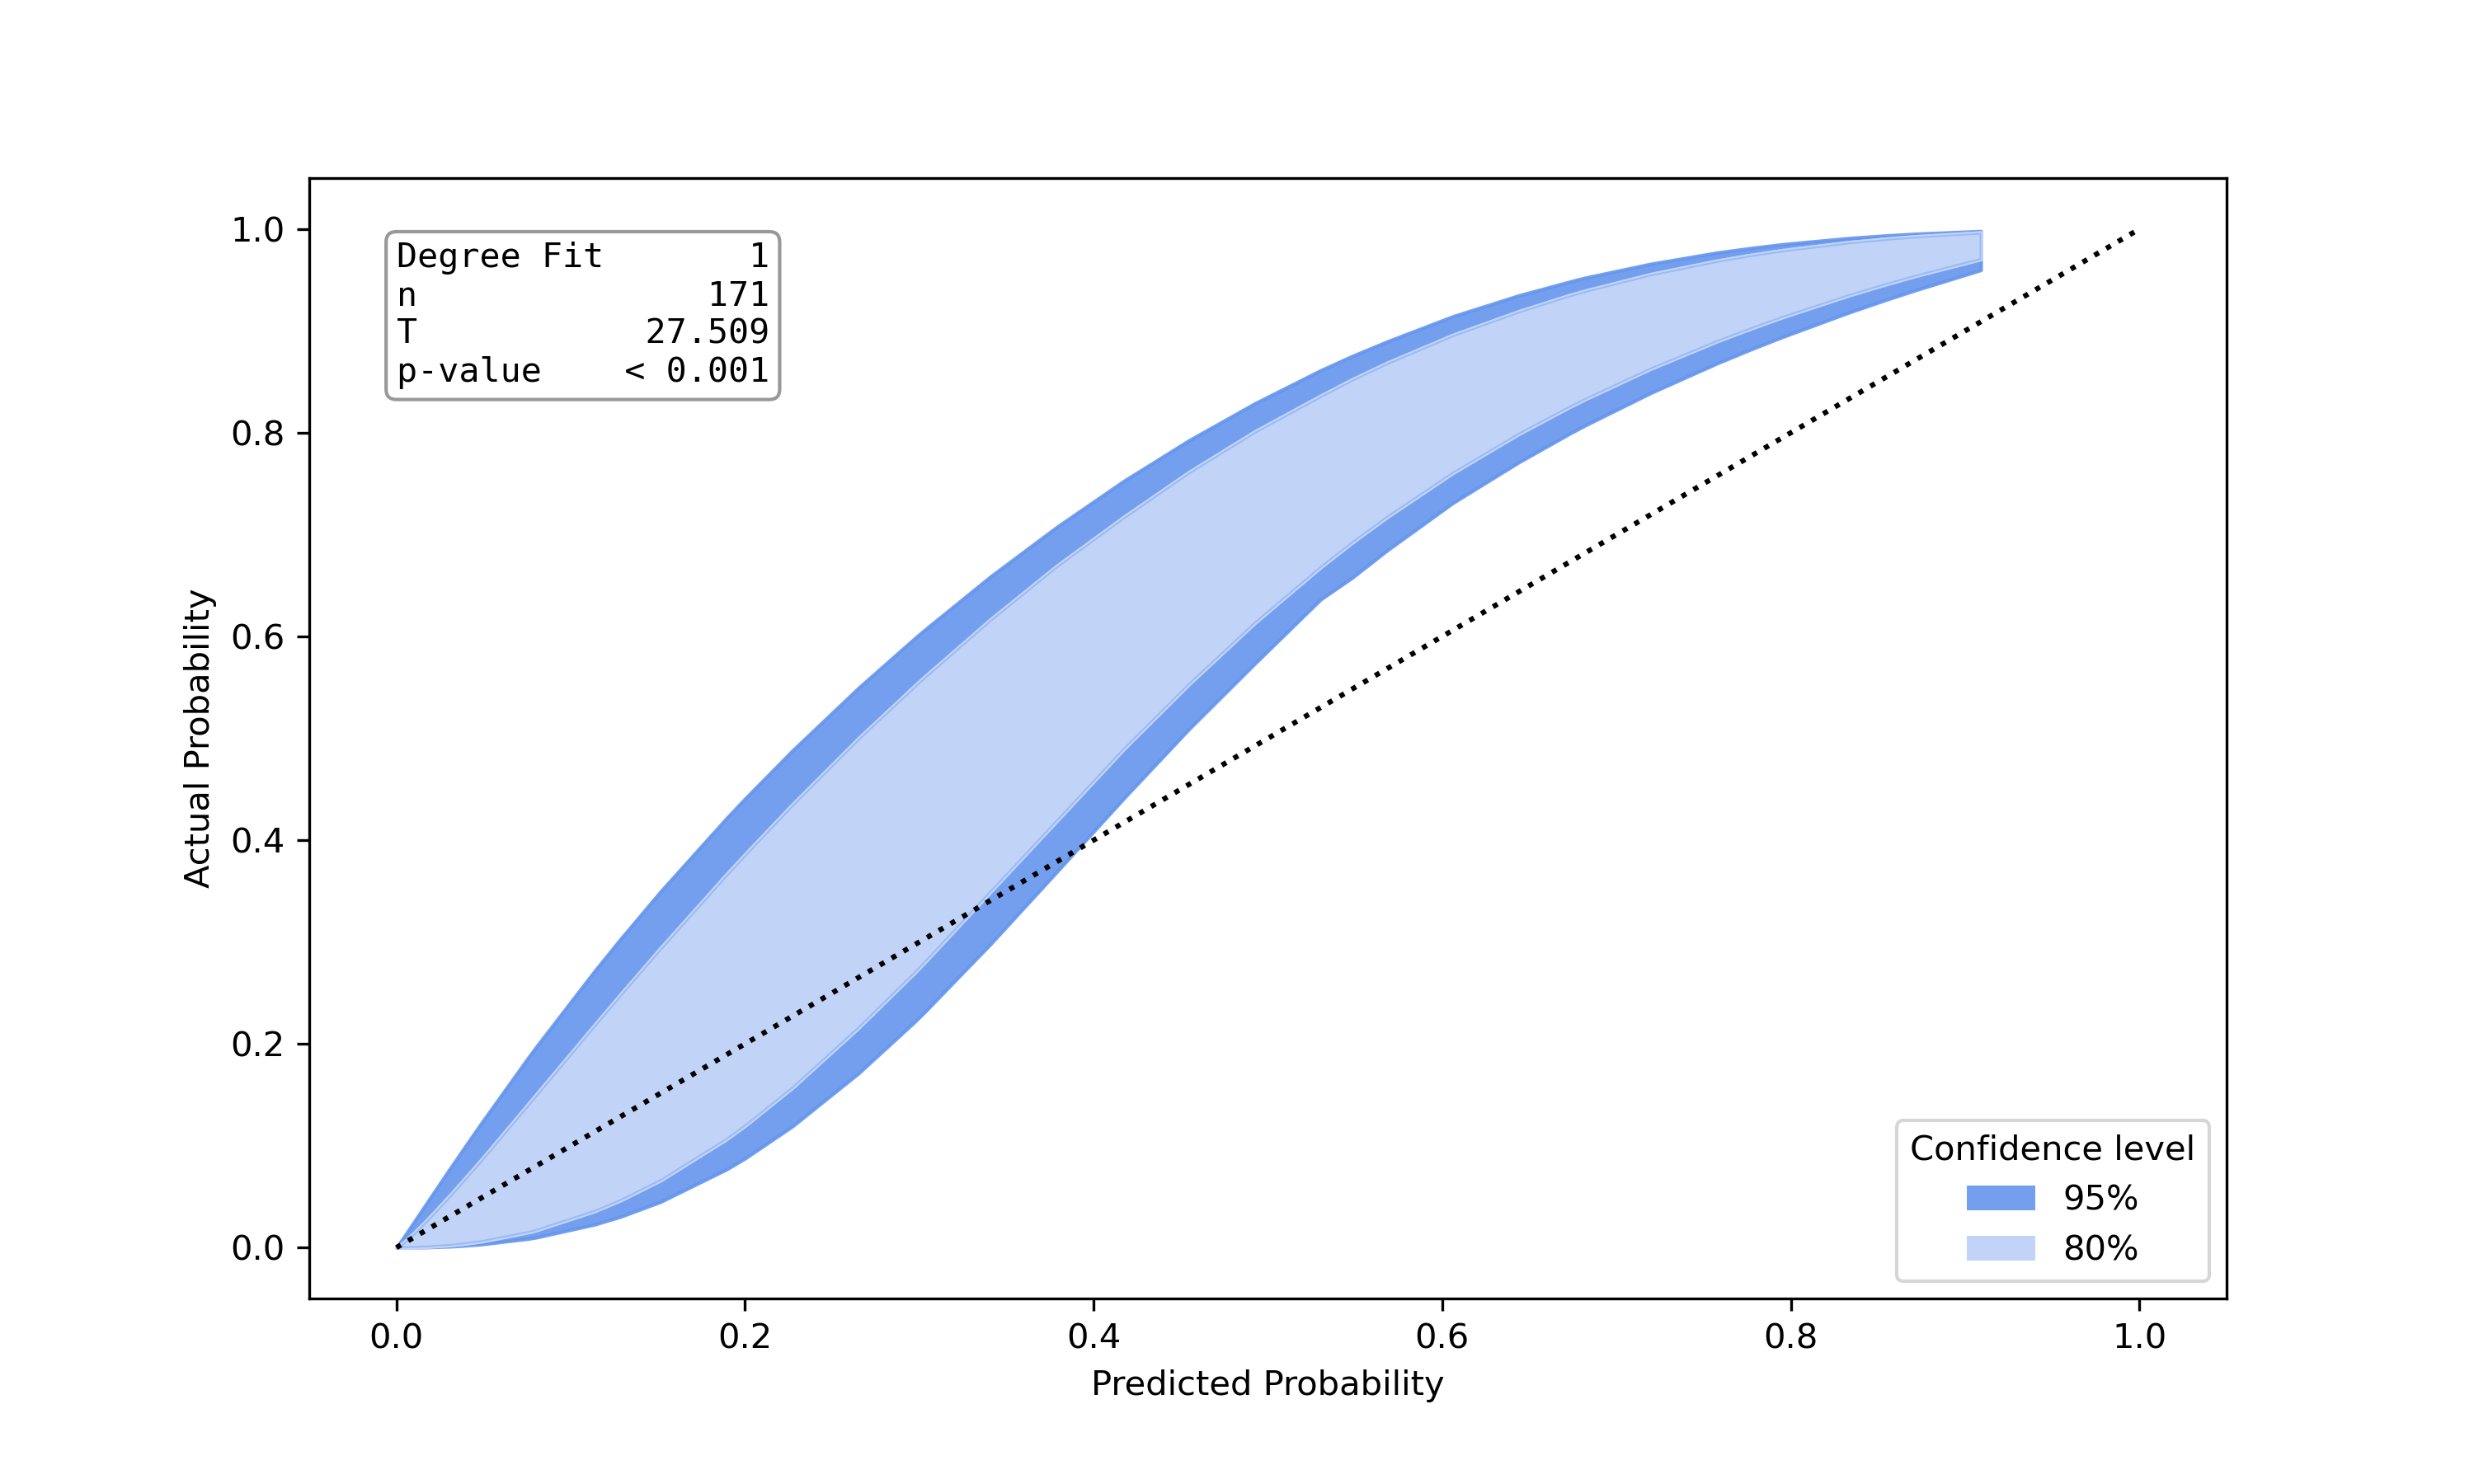
- Show calibration belt
ce.calbelt(plot=True)
- Get various metrics
ce.metrics()
- Create pdf calibration report
ce.calibration_report('report.pdf', 'my_model')
See the documentation of single methods for detailed usage examples.
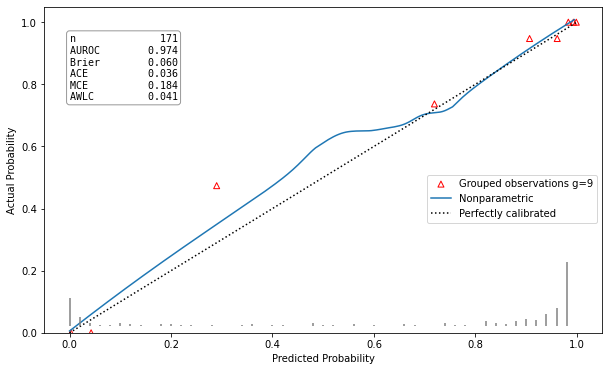
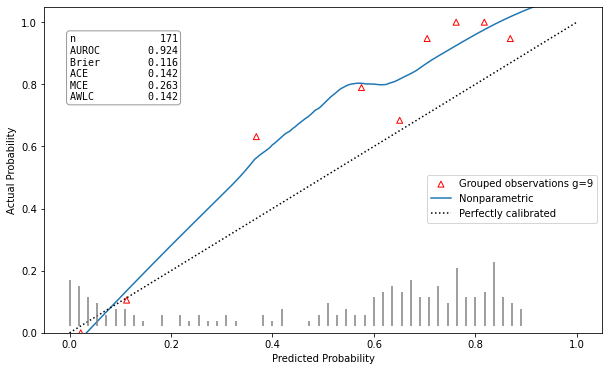
Example Results
| Well calibrated model | Poorly calibrated model |
|---|---|
 |
 |
 |
 |
hltest_result(statistic=4.982635477424991, pvalue=0.8358193332183672, dof=9) |
hltest_result(statistic=26.32792475118742, pvalue=0.0018051545107069522, dof=9) |
ztest_result(statistic=-0.21590257919669287, pvalue=0.829063686607032) |
ztest_result(statistic=-3.196125145498827, pvalue=0.0013928668407116645) |
Features
- Statistical tests for binary model calibration
- Hosmer Lemeshow Test
- Pigeon Heyse Test
- Spiegelhalter z-test
- Calibration belt
- Graphical represantions showing calibration of binary models
- Calibration plot
- Calibration belt
- Various Metrics
- Brier Score
- Adaptive Calibration Error
- Maximum Calibration Error
- Area within LOWESS Curve
- (AUROC)
The above features are explained in more detail in PyCalEva's documentation
References
-
Statistical tests and metrics:
[1] Hosmer Jr, David W., Stanley Lemeshow, and Rodney X. Sturdivant. Applied logistic regression. Vol. 398. John Wiley & Sons, 2013.
[2] Pigeon, Joseph G., and Joseph F. Heyse. An improved goodness of fit statistic for probability prediction models. Biometrical Journal: Journal of Mathematical Methods in Biosciences 41.1 (1999): 71-82.
[3] Spiegelhalter, D. J. (1986). Probabilistic prediction in patient management and clinical trials. Statistics in medicine, 5(5), 421-433.
[4] Huang, Y., Li, W., Macheret, F., Gabriel, R. A., & Ohno-Machado, L. (2020). A tutorial on calibration measurements and calibration models for clinical prediction models. Journal of the American Medical Informatics Association, 27(4), 621-633.
-
Calibration plot:
[5] Jr, F. E. H. (2021). rms: Regression modeling strategies (R package version 6.2-0) [Computer software]. The Comprehensive R Archive Network. Available from https://CRAN.R-project.org/package=rms
-
Calibration belt:
[6] Nattino, G., Finazzi, S., & Bertolini, G. (2014). A new calibration test and a reappraisal of the calibration belt for the assessment of prediction models based on dichotomous outcomes. Statistics in medicine, 33(14), 2390-2407.
[7] Bulgarelli, L. (2021). calibrattion-belt: Assessment of calibration in binomial prediction models [Computer software]. Available from https://github.com/fabiankueppers/calibration-framework
[8] Nattino, G., Finazzi, S., Bertolini, G., Rossi, C., & Carrara, G. (2017). givitiR: The giviti calibration test and belt (R package version 1.3) [Computer software]. The Comprehensive R Archive Network. Available from https://CRAN.R-project.org/package=givitiR
-
Others:
[9] Sturges, H. A. (1926). The choice of a class interval. Journal of the american statistical association, 21(153), 65-66.
For most of the implemented methods in this software you can find references in the documentation as well.

