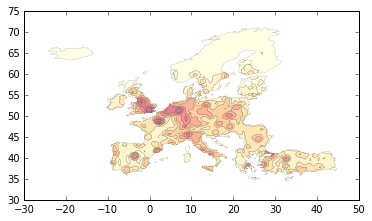
smoomapy
Make smoothed maps in your python environnement
More or less a python port of Stewart method from R SpatialPositon package (https://github.com/Groupe-ElementR/SpatialPosition/).
Allow to set a desired number of class and choose discretization method or directly set some custom breaks values.
Input/output can be a path to a geographic layer (GeoJSON, shp, etc.) or a GeoDataFrame.
Requires:
- Numpy
- GeoPandas
- Matplotlib
Documentation on the method :
Please refer to https://github.com/Groupe-ElementR/SpatialPosition/ documentation.
Usage example:
One-shot functionnality
>>> result = quick_stewart('nuts3_data.geojson',
                           "pop1999",
                           span=65000,
                           beta=3,
                           resolution=48000,
                           mask='nuts3_data.geojson',
                           nb_class=10,
                           user_defined_breaks=None,
                           output="geojson")
Object-oriented API, allowing to easily redraw contours with new breaks values
>>> StePot = SmoothStewart('nuts3_data.geojson', "pop1999",
                           span=65000, beta=3,
                           resolution=60000,
                           mask='nuts3_data.geojson')
>>> res = StePot.render(nb_class=8, disc_func="jenks",
                        output="GeoDataFrame")
>>> res.plot(cmap="YlOrRd", linewidth=0.1)
The long part of the computation is done during the initialization of
SmoothStewart instance (i.e. actually computing potentials). Some
convenience methods allows to tweak and re-export the few last steps :
Allow to quickly redraw polygons with a new classification method
Availables classification methods are: "equal_interval", "prog_geom", "jenks", "percentiles" and "head-tail-breaks"
>>> res = StePot.render(nb_class=6,
                        disc_func="percentiles",
                        output="GeoDataFrame")
Allow to set custom break values (highly recommended after a first rendering or having take a look at the distibution):
>>> my_breaks = [0, 1697631, 3395263, 5092894, 6790526,
                 8488157, 10185789, 11883420, 13581052]

>>> res = StePot.render(nb_class=6, user_defined_breaks=my_breaks,
                        output="GeoDataFrame")
Installation:
From PyPI :
$ pip install smoomapyFrom github :
$ git clone http://github.com/mthh/smoomapy.git
$ cd smoomapy/
$ python setup.py install
