Tanto
Overview
To monitor the servers with Shinken, Nagios or Icinga, system administrators usually configure active checks of the monitored servers. It means the monitoring system must have a direct network access to the monitored server.
With Tanto, this model is reverted, it does passive checks of your monitored servers. You don't need to open an access from your monitoring system to the monitored servers.
The main use case of this tool is to monitor distant servers in a complex network where you can't connect directly for security reasons, typically with a large client. You need only to open NSCA or HTTP(S) port from the monitored server to the monitoring system.
Moreover, if you don't have a monitoring server, Tanto has a standalone mode. You will receive alerts via e-mail directly.
Technical details
The behaviour of this tool is simple:
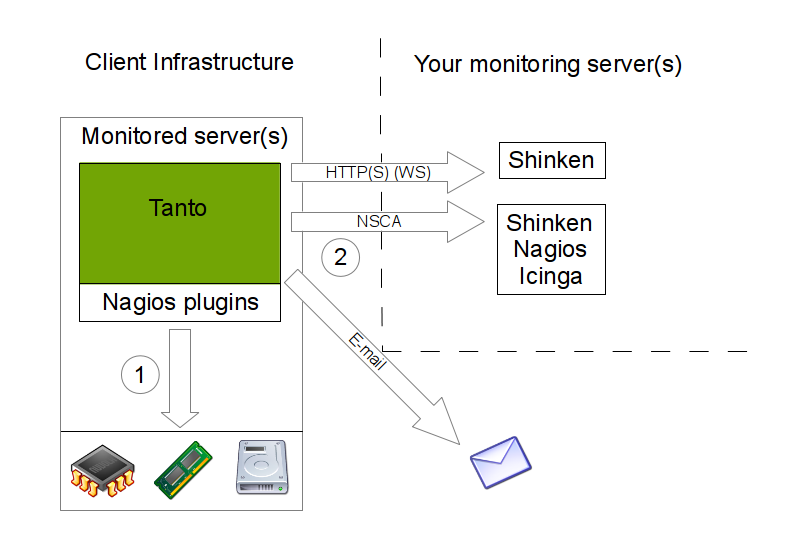
- The program is started by cron.
- It retrieves monitoring data (1) from nagios-plugins.
- Finally, it pushes the data (2) via NSCA (Shinken, Nagios, Icinga), HTTP(S) (Shinken) to the monitoring server or via SMTP.
- (WS-Shinken only) If the connexion between the monitored server and the monitoring system is broken, data is kept in a cache file, to be re-send the next run.
Warning: WS-Shinken support isn't finished.
How to install ?
You install as you wish, via sources, pip or Debian package. If you use another distribution, you can use the Python package or contribute to publish a package for your distribution.
Debian
We provide a Debian package source in the debian/ folder.
Python package
pip install tanto
Usage
- Default config files location: /etc/tanto/
- Default cron file location: /etc/cron.d/
- Configure the nagios plugins you want to use in inputs/nagios_plugins.cfg:
- Define the nagios plugins path with the path option in [default_settings] section.
- The name of each section is the nagios plugin command.
- Each setting is a CLI option of the nagios plugin.
- Adapt the checks frequency in: /etc/cron.d/tanto.
Standalone mode
- Configure e-mail notifications in outputs/email.cfg.
With a monitoring server
- Configure passive checks on your monitoring system:
- Fill in the credidentials for your monitoring system in outputs/nsca.cfg or outputs/ws_shinken.cfg.
CLI options
Launch: tanto --help You can override the location of each config file with a CLI parameter.
Debug
By default, it uses cron syslog and console for the logs. You can customize this behaviour in logging.ini: http://docs.python.org/library/logging.config.html#configuration-file-format
Support
Community support is provided via Github: https://github.com/Eyepea/tanto/issues
You must provide the error log with your issue.
If you need professional support, please contact Eyepea: http://www.eyepea.eu/
For general questions or contributions, you can contact me via my Github acccount: https://github.com/GMLudo
Special thanks
The Shinken community in general, and Jean Gabès in particular for his help and support.


