VisualML: Visualization of multi-dimensional Machine Learning models
Update: This is stil a beta version and it is not fully working. Please check the issues tab. Any help on this project would be highly appreciated :)
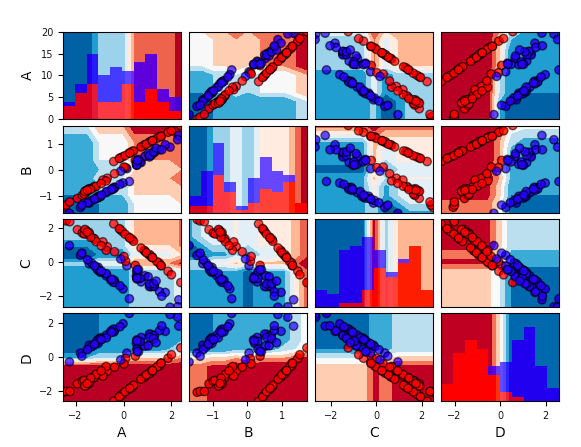
VisualML is a library for visualizing the decision boundary of multi-dimensional machine learning models from sklearn using 2D projections of pairs of features. Here's an example:
import visualml as vml
import pandas as pd
from sklearn.datasets import make_classification
from sklearn.ensemble import RandomForestClassifier as RF

# Create a toy classification dataset
feature_names = ['A','B','C','D']
X, y = make_classification(n_features=4, random_state=42)

# The visualization is only supported if X is a pandas df
X = pd.DataFrame(X, columns=feature_names)

# Train a classifier
clf = RF(random_state=42).fit(X,y)

# Plot decision boundary grid
vml.decision_boundary_grid(clf, X, y)
Issues and Limitations
- The input set of features should be a Pandas Dataframe
- The target variable has to be binary
- Support to regression and multiclassification can be implemented in the future
- The training and testing set can't be visualized as different sets.
- Histogram colors are sometimes inverted (Issue #2)
