pl-z2labelmap

Table of Contents
Abstract
zlabelmap.py generates FreeSurfer labelmaps from z-score vector files. These labelmap files are used by FreeSurfer to color-code parcellated brain regions. By calculating a z-score to labelmap transform, we are able to show a heat map and hightlight brain regions that differ from some comparative reference, as demonstrasted below
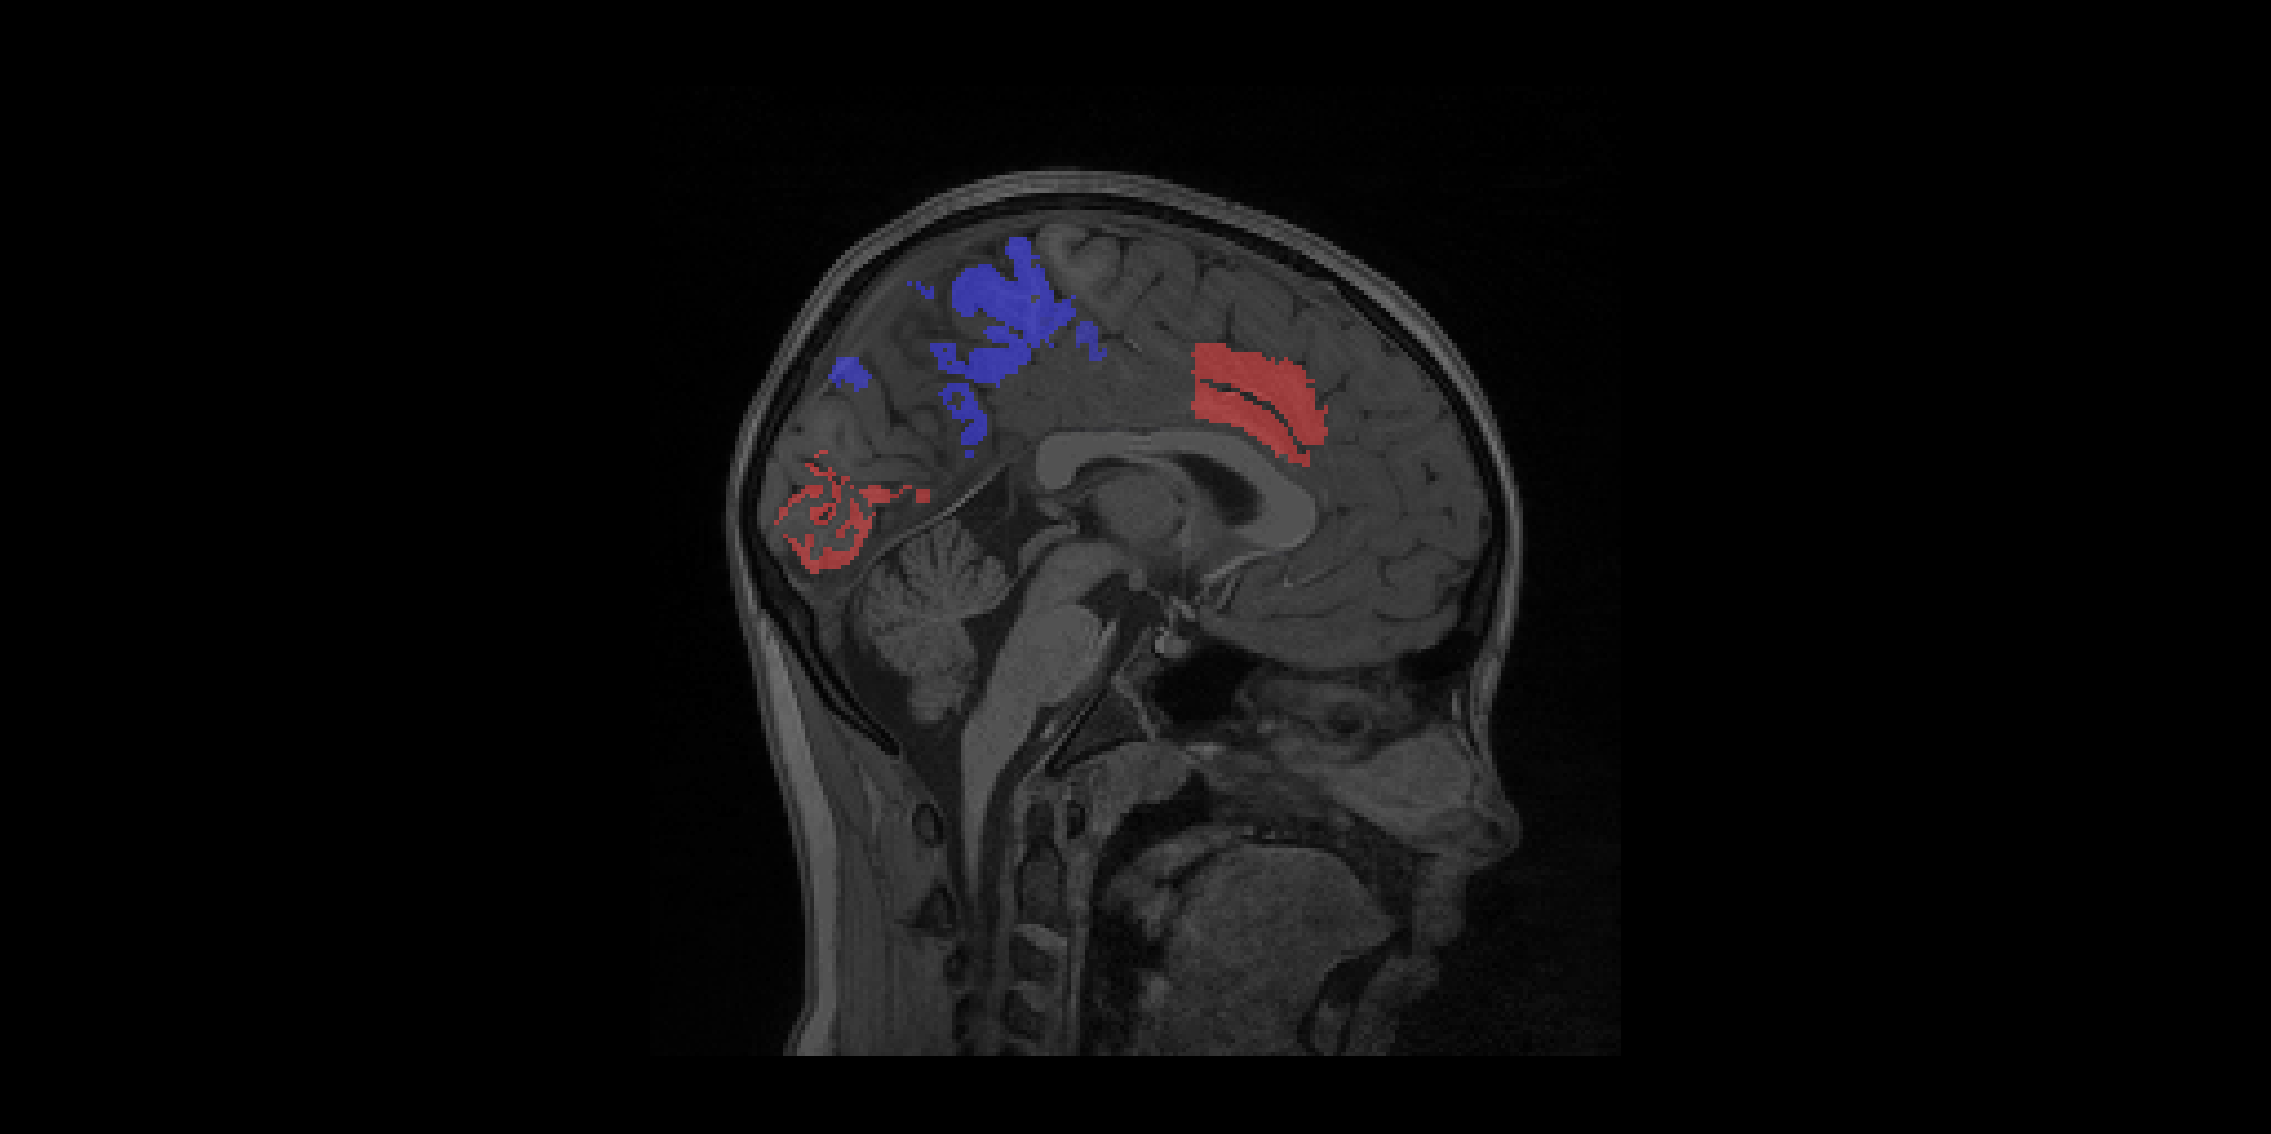
where positive volume deviations of a parcellated brain region are shown in red (i.e. the subject had a larger volume in that area than the reference), and negative volume deviations are shown in blue (i.e. the subject had a smaller volume in that area than reference).
Note that these are randomly generated z-scores purely for illustrative purposes.
Essentially the script consumes an input text vector file of
<str_structureName> <float_lh_zScore> <float_rh_zScore>
for example,
G_and_S_frontomargin     ,1.254318450576827,-0.8663546810093861
G_and_S_occipital_inf    ,1.0823728865077271,-0.7703944006354377
G_and_S_paracentral      ,0.20767669866335847,2.9023126278939912
G_and_S_subcentral       ,2.395503357157743,-1.4966482475891556
G_and_S_transv_frontopol ,-1.7849555258577423,-2.461419463760234
G_and_S_cingul-Ant       ,-2.3831737860960382,1.1892593438667625
G_and_S_cingul-Mid-Ant   ,0.03381695289572084,-0.7909116233500506
G_and_S_cingul-Mid-Post  ,-2.4096082230335485,1.166457973597625
                          ...
                          ...
S_postcentral            ,1.3277159068067768,-1.4042773812503526
S_precentral-inf-part    ,-1.9467169777576718,1.7216636236995733
S_precentral-sup-part    ,0.764673539853991,2.1081570332369504
S_suborbital             ,0.522368665639954,-2.3593237820349007
S_subparietal            ,-0.14697262729901928,-2.2116605141889094
S_temporal_inf           ,-1.8442944920810271,-0.6895142771486307
S_temporal_sup           ,-1.8645248463693804,2.740099589311164
S_temporal_transverse    ,-2.4244451521560073,2.286596403222344
and creates a FreeSurfer labelmap where <str_structureName> colors correspond to the z-score (normalized between 0 and 255).
Currently, only the aparc.a2009s FreeSurfer segmentation is fully supported, however future parcellation support is planned.
Negative z-scores and positive z-scores are treated in the same manner but have sign-specific color specifications. Positive and negative z-Scores can be assigned some combination of the chars RGB to indicate which color dimension will reflect the z-Score. For example, a
--posColor R --negColor RG
will assign positive z-scores shades of red and negative z-scores shades of yellow (Red + Green = Yellow).
Synopsis
python z2labelmap.py                                            \
    [-v <level>] [--verbosity <level>]                          \
    [--random] [--seed <seed>]                                  \
    [-p <f_posRange>] [--posRange <f_posRange>]                 \
    [-n <f_negRange>] [--negRange <f_negRange>]                 \
    [-P <'RGB'>] [--posColor <'RGB'>]                           \
    [-N  <'RGB'>] [--negColor <'RGB'>]                          \
    [--imageSet <imageSetDirectory>]                            \
    [-s <f_scaleRange>] [--scaleRange <f_scaleRange>]           \
    [-l <f_lowerFilter>] [--lowerFilter <f_lowerFilter>]        \
    [-u <f_upperFilter>] [--upperFilter <f_upperFilter>]        \
    [-z <zFile>] [--zFile <zFile>]                              \
    [--version]                                                 \
    [--man]                                                     \
    [--meta]                                                    \
    <inputDir>                                                  \
    <outputDir>
Run
This plugin can be run in two modes: natively as a python package or as a containerized docker image.
Using PyPI
To run from PyPI, simply do a
pip install z2labelmapand run with
z2labelmap.py --man /tmp /tmpto get inline help.
Using docker run
To run using docker, be sure to assign an "input" directory to /incoming and an output directory to /outgoing. Make sure that the $(pwd)/out directory is world writable!
Now, prefix all calls with
docker run --rm -v $(pwd)/in:/incoming -v $(pwd)/out:/outgoing      \
        fnndsc/pl-z2labelmap z2labelmap.py                          \
Thus, getting inline help is:
docker run --rm -v $(pwd)/in:/incoming -v $(pwd)/out:/outgoing      \
        fnndsc/pl-z2labelmap z2labelmap.py                          \
        --man                                                       \
        /incoming /outgoing
Examples
Create a sample/random z-score file and analyze
- In the absense of an actual z-score file, the script can create one. This can then be used in subsequent analysis:
mkdir in out
docker run --rm -v $(pwd)/in:/incoming -v $(pwd)/out:/outgoing  \
        fnndsc/pl-z2labelmap z2labelmap.py                      \
        --random --seed 1                                       \
        --posRange 3.0 --negRange -3.0                          \
        /incoming /outgoing
or without docker
mkdir in out
z2labelmap.py                                                   \
        --random --seed 1                                       \
        --posRange 3.0 --negRange -3.0                          \
        /in /out
In this example, z-scores range between 0.0 and (+/-) 3.0.
Generate labelmap and also copy pre-calculated image set to output
- Analyze a file already located at
in/zfile.csvand copy pre-calculated image data
docker run --rm -v $(pwd)/in:/incoming -v $(pwd)/out:/outgoing  \
        fnndsc/pl-z2labelmap z2labelmap.py                      \
        --negColor B --posColor R                               \
        --imageSet ../data/set1                                 \
        /incoming /outgoing
This assumes a file called 'zfile.csv' in the <inputDirectory> that ranges in z-score between 0.0 and 3.0, and uses the --scaleRange to reduce the apparent brightness of the map by 50 percent. Furthermore, the lower 80 percent of z-scores are removed (this has the effect of only showing the brightest 20 percent of zscores).
Control relative brightness and lower filter low z-scores from final labelmap
- To analyze a file already located at
in/zfile.csv, apply ascaleRangeand also filter out the lower 80% of z-scores:
docker run --rm -v $(pwd)/in:/incoming -v $(pwd)/out:/outgoing  \
        fnndsc/pl-z2labelmap z2labelmap.py                      \
        --scaleRange 2.0 --lowerFilter 0.8                      \
        --negColor B --posColor R                               \
        /incoming /outgoing
This assumes a file called 'zfile.csv' in the <inputDirectory> that ranges in z-score between 0.0 and 3.0, and uses the --scaleRange to reduce the apparent brightness of the map by 50 percent. Furthermore, the lower 80 percent of z-scores are removed (this has the effect of only showing the brightest 20 percent of zscores).
Using the above referenced z-score file, this results in:
0       Unknown                         0   0   0   0
11101       lh-G_and_S_frontomargin         0       0       0       0
11102       lh-G_and_S_occipital_inf        0       0       0       0
11103       lh-G_and_S_paracentral          0       0       0       0
11104       lh-G_and_S_subcentral           103     0       0       0
11105       lh-G_and_S_transv_frontopol     0       0       0       0
11106       lh-G_and_S_cingul-Ant           0       0       110     0
11107       lh-G_and_S_cingul-Mid-Ant       0       0       0       0
11108       lh-G_and_S_cingul-Mid-Post      0       0       111     0
                            ...
                            ...
12167       rh-S_postcentral                0       0       0       0
12168       rh-S_precentral-inf-part        0       0       0       0
12169       rh-S_precentral-sup-part        0       0       0       0
12170       rh-S_suborbital                 0       0       110     0
12171       rh-S_subparietal                0       0       103     0
12172       rh-S_temporal_inf               0       0       0       0
12173       rh-S_temporal_sup               119     0       0       0
12174       rh-S_temporal_transverse        0       0       0       0
Command line arguments
<inputDir>
Required argument.
Input directory for plugin.

<outputDir>
Required argument.
Output directory for plugin.

[-v <level>] [--verbosity <level>]
Verbosity level for app. Not used currently.

[--random] [--seed <seed>]
If specified, generate a z-score file based on <posRange> and <negRange>.  In addition, if a further optional <seed> is passed, then initialize the random generator with that seed, otherwise system time is used.

[-p <f_posRange>] [--posRange <f_posRange>]
Positive range for random max deviation generation.

[-n <f_negRange>] [--negRange <f_negRange>]
Negative range for random max deviation generation.

[-P <'RGB'>] [--posColor <'RGB'>]
Some combination of 'R', 'G', B' for positive heat.

[-N  <'RGB'> [--negColor <'RGB'>]
Some combination of 'R', 'G', B' for negative heat.

[--imageSet <imageSetDirectory>]
If specified, will copy the (container) prepopulated image set in <imageSetDirectory> to the output directory.

[-s <f_scaleRange>] [--scaleRange <f_scaleRange>]
Scale range for normalization. This has the effect of controlling the
brightness of the map. For example, if this 1.5 the effect
is increase the apparent range by 50% which darkens all colors values.

[-l <f_lowerFilter>] [--lowerFilter <f_lowerFilter>]
Filter all z-scores below (normalized) <lowerFilter> to 0.0.

[-u <f_upperFilter>] [--upperFilter <f_upperFilter>]
Filter all z-scores above (normalized) <upperFilter> to 0.0.

[-z <zFile>] [--zFile <zFile>]
z-score file to read (relative to input directory). Defaults to 'zfile.csv'.

[--version]
If specified, print version number.

[--man]
If specified, print (this) man page.

[--meta]
If specified, print plugin meta data.
