MemoryTracker 
MemoryTracker finds where the memory bloat comes from in a Rails application.
Features
- Collect stats on each controller action memory consumption.
- Display stats on every controller action of the application in a web page (the dashboard) embedded in the gem.
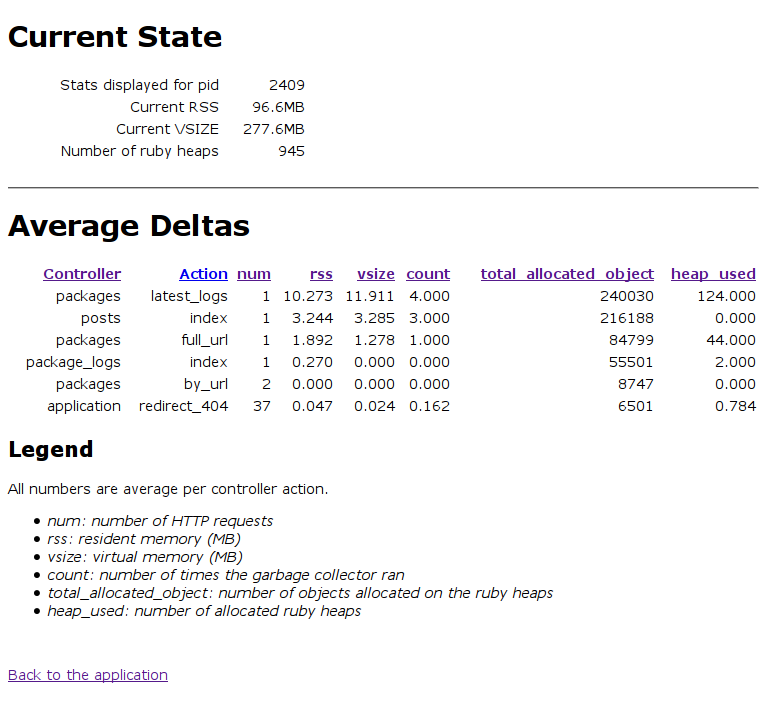
Dashboard
Screenshot
The dashboard is at /memtracker in the host application (but you need to mount the engine in the app first, see below).
That's where the collected statistics are displayed.
What to look for?
- Controller actions that have a non zero "heap used" value. Those actions required more memory than was available in the currently allocated heaps.
- Controller actions that have a "total_allocated_object" value N times higher than the average.
- Controller actions that trigger the garbage collector frequently. That the "count" value in the dashboard.
Enabling MemoryTracker
Add it to your Gemfile:
gem 'memory_tracker'To get access to the MemoryTracker UI and see the stats, the engine must be mounted at config/routes.rb
mount MemoryTracker::Engine => "/memtracker"How does it work?
MemoryTracker uses system memory data and Ruby garbage collector statistics to find the memory currently used by The Rails processes, how many objects were allocated in Ruby heaps, how many heaps were created and how many times the garbage collector ran. The MemoryTracker middleware captures the data before and after each HTTP request and saves the deltas per controller/action in one or more stores.
MemoryTracker is implemented as a Rails engine and reports its statistics in a web page served by the application where it's embedded. The report currently includes data from the InMemoryStore.
Stores
MemoryTracker currently comes with 3 stores.
-
The InMemoryStore keeps counters in memory for the process where it runs. This store in itself uses very little memory as it only keeps a set of counters per controller/action in the application. Since it doesn't do any IO, it is also extremely fast. The data is immediately available without any need for a background aggregation tasks.
-
The GcStatLogfile store simply writes memory stats to a log file called '#{Rails.root}/log/memtracker_gcstat.log' after each HTTP request.
-
The UrlLogfileStore also stores data in a log file ('#{Rails.root}/log/memtracker_urls.log') but instead of writing the raw memory data, it records the URL that was requested along with the memory deltas between the current request and the previous one. It also highlights the urls where the deltas were the greatest. It's sometimes interesting to browse through this file URLs that are particularly greedy.
Config file
The config file is optional. If you choose to write one, place it in "#{Rails.root}/config". In the absence of a custom config file, memory_tracker will fallback to the file linked above in the gem.
By creating you own config file, you can choose which stores are enabled and tune them. By default all stores are enabled. Here is a sample config file that enables only the InMemoryStore with a 4 hour long data window:
defaults:   &defaults
  stores:
    - name: memory
      window_length: 14400


production:
  <<: *defaults

development:
  <<: *defaults

test:
  <<: *defaults
Requirements
The gem has been tested and is compatible with:
- Ruby 2.0
- Ruby 1.9 but 1.9 GC.stat does not include the total_allocated_object number so its value remains at 0 in MemoryTracker.
- Rails 3.2, Rails 4.0
Tips
- Ruby processes rarely leak memory. Instead they allocate memory whenever they need it and never release it. This memory is not lost, it's still available to the process that allocated it but it's unavailable for all other processes in the system.
- It doesn't matter if the average controller action in the application only consumes 50MB of memory, the size of the process will still reach 100MB if a single one of the controller actions requires 100MB. Therefore, the biggest bang for the bug is to be found in the action at the top of the list. Fix that one and the whole process memory will go down to the level of the second most expensive controller action.
- You want the heap_used to be 0, always. If not 0, it means this controller action asked for an amount of memory that required the allocation of new heaps.
- rss and vsize should be very low in a memory conscious application.
- total_allocated_heaps should mostly be in the same range for all controller actions. Outliers are the ones causing memory bloat.
- The stats are only meaningful in the production environment. Do not believe anything you see in the development environment.
Coming soon
- Redis store.
- Store and report the most expensive URLs.
Contributing to memory_tracker
- Check out the latest master to make sure the feature hasn't been implemented or the bug hasn't been fixed yet.
- Check out the issue tracker to make sure someone already hasn't requested it and/or contributed it.
- Fork the project.
- Start a feature/bugfix branch.
- Commit and push until you are happy with your contribution.
- Make sure to add tests for it. This is important so I don't break it in a future version unintentionally.
- Please try not to mess with the Rakefile, version, or history. If you want to have your own version, or is otherwise necessary, that is fine, but please isolate to its own commit so I can cherry-pick around it.
References
Copyright
See LICENSE.txt.

