This package allows you to visualize your RDFlib graph objects in two ways: as triple tables or a network visualization.
In the triple tables, you can filter the triples by subject, predicate or object value.
In the network visualizations, you can see the relations between entities, and the literals associated with them.
pip install irdf
import rdflib
import irdf

# Create a Graph
g = rdflib.Graph()

# Parse in an RDF file hosted on the Internet
g.parse('http://dbpedia.org/data/Vrije_Universiteit_Amsterdam.ttl')
# Get an interactive table
irdf.table(g)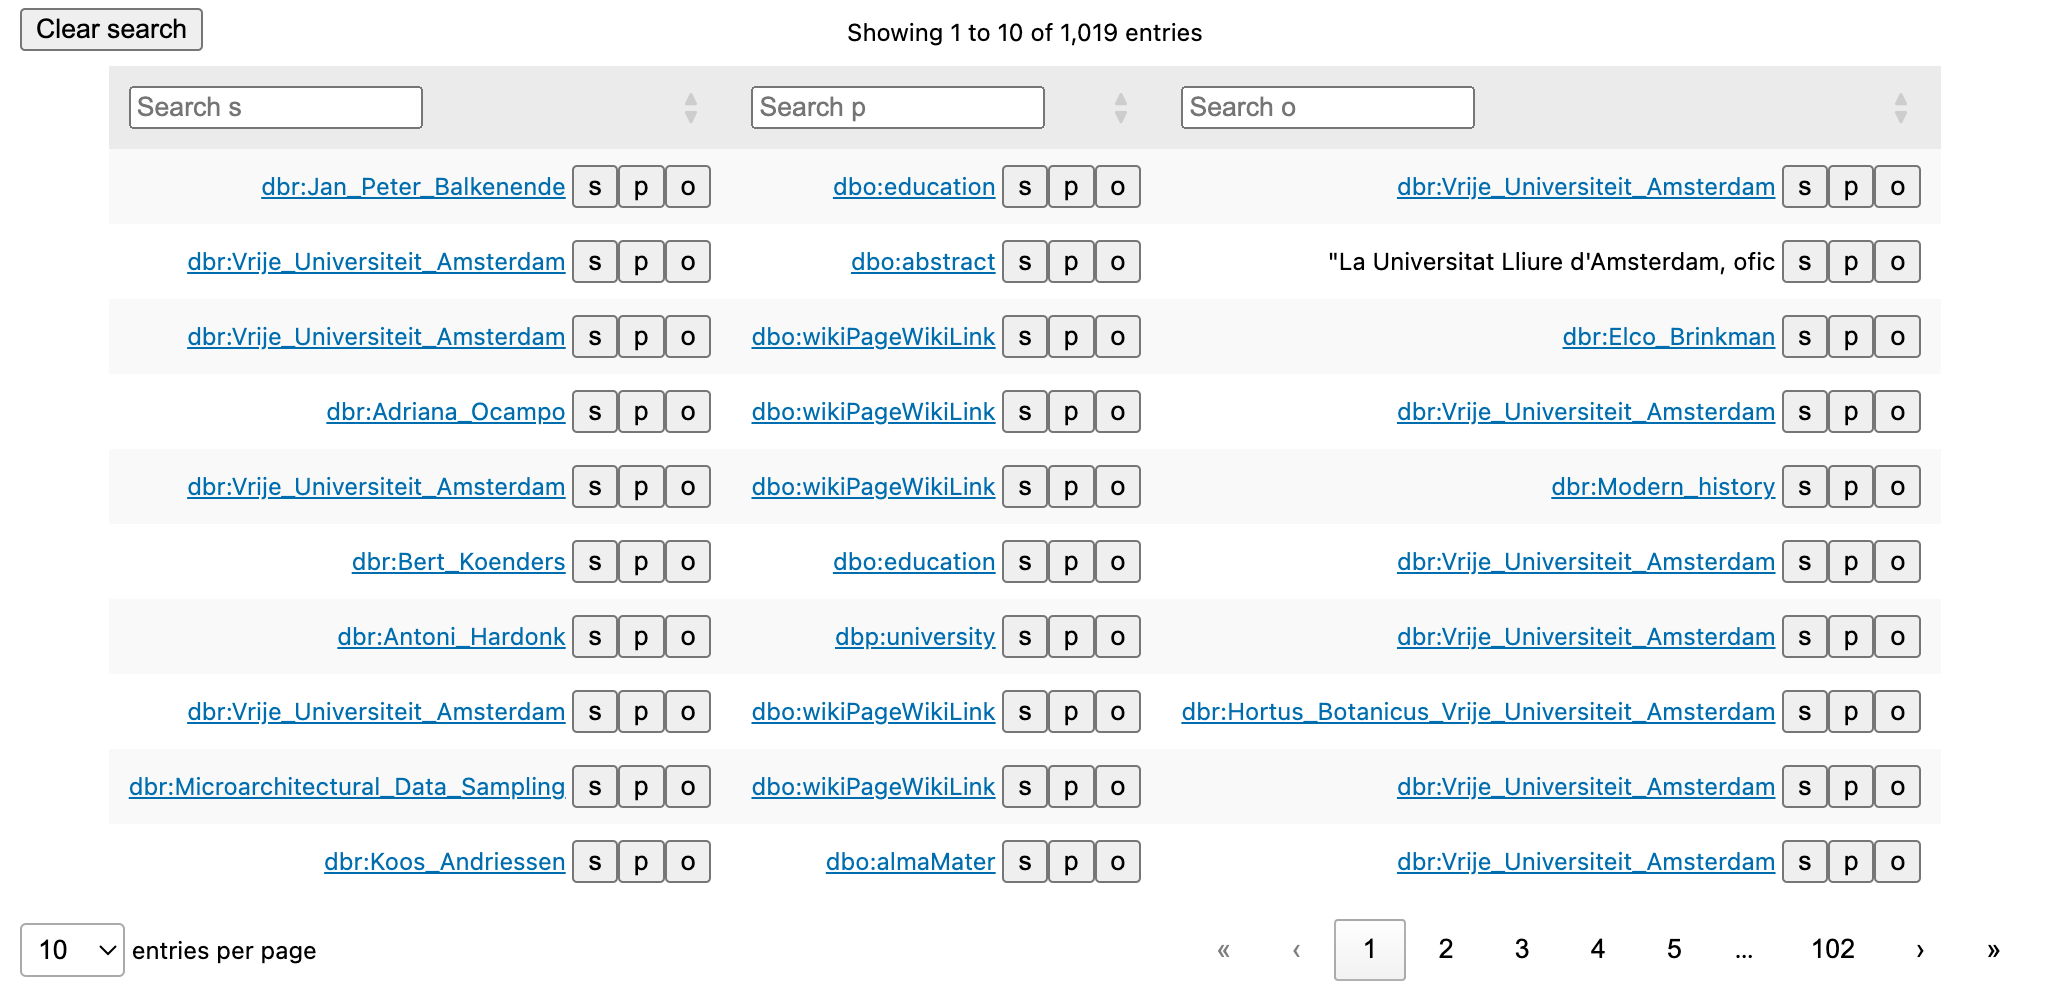
# Get an interactive graph (filtering on certain properties)
# Click on nodes to see associated literals!
irdf.graph(g, p_filter=['/ontology/', 'depiction'], lang='en')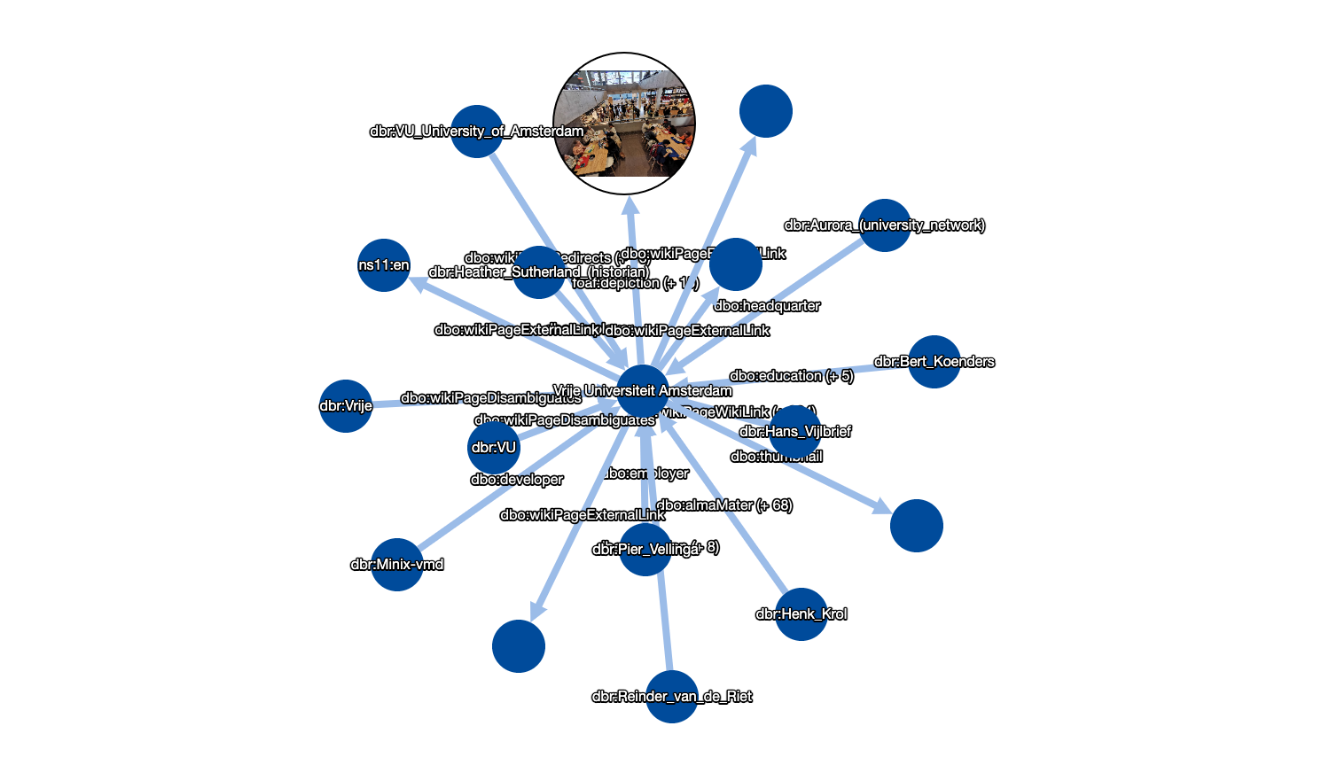
In Wikidata, the labels of properties are associated with special property entities. To get nice labels on edges in your visualization, you can specify a custom SPARQL property path to fetch them:
import rdflib, irdf
g = rdflib.Graph()
g.parse('https://www.wikidata.org/wiki/Special:EntityData/Q1065414.ttl')
label_path = '(^wikibase:directClaim)*/rdfs:label'
irdf.graph(g, p_filter=['/direct/'], lang='en', label_path=label_path)This library is based on the great work of ipycytoscape and itables.
