![]()
PySTXIView is a Python library to create and display STIX2 graphs.
PySTIXView is based on pyvis that allows you to create graph and visualize them in your browser or in Jupyter Notebook.
- python3 (tested on python 3.12)
- pyvis
- stix2
pip install PySTIXview
git clone https://github.com/vincenzocaputo/PySTIXView
cd PySTIXView
pip install .
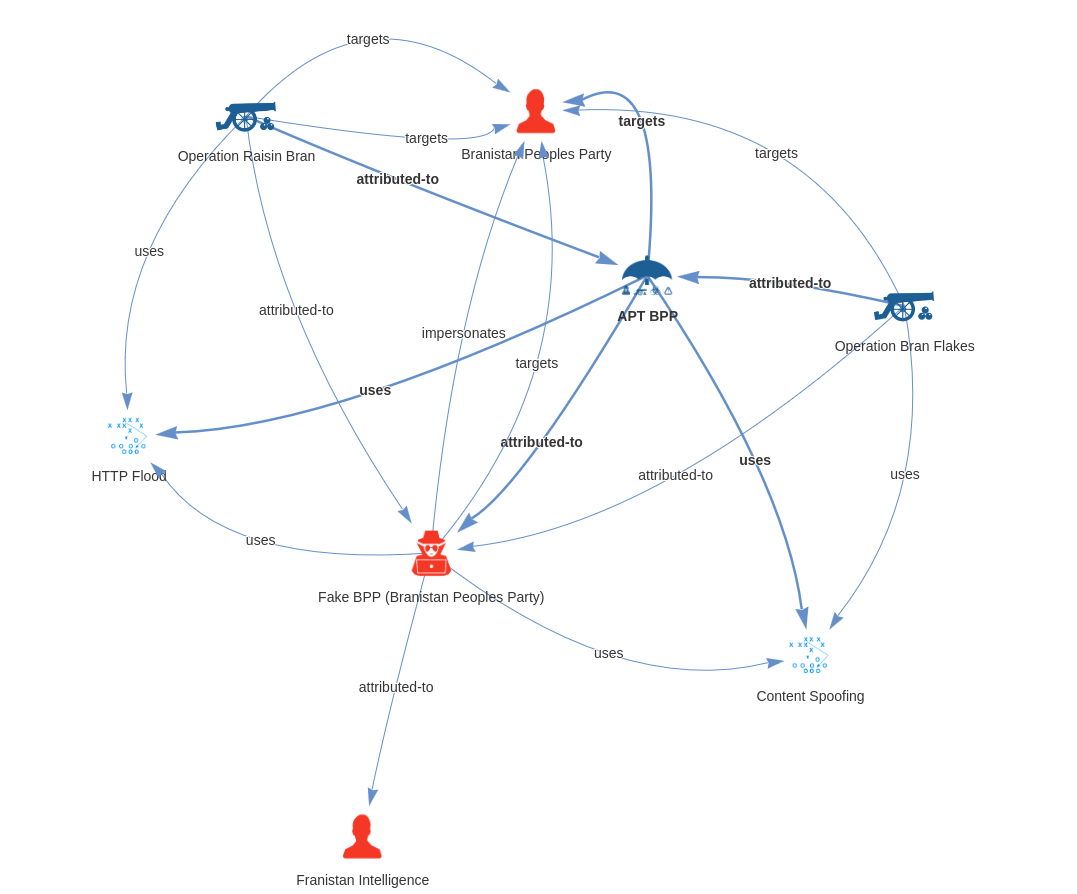
Below is a simple example to create a graph from the STIX2 Bundle Threat Actor Leveraging Attack Patterns and Malware. (The JSON file is available at https://github.com/oasis-open/cti-documentation/blob/main/examples/example_json/threat-actor-leveraging-attack-patterns-and-malware.json)
from pystixview import PySTIXView
stix_graph = PySTIXView()
with open("threat-actor-leveraging-attack-patterns-and-malware.json", "r") as fd:
stix_graph.add_bundle(fd.read())
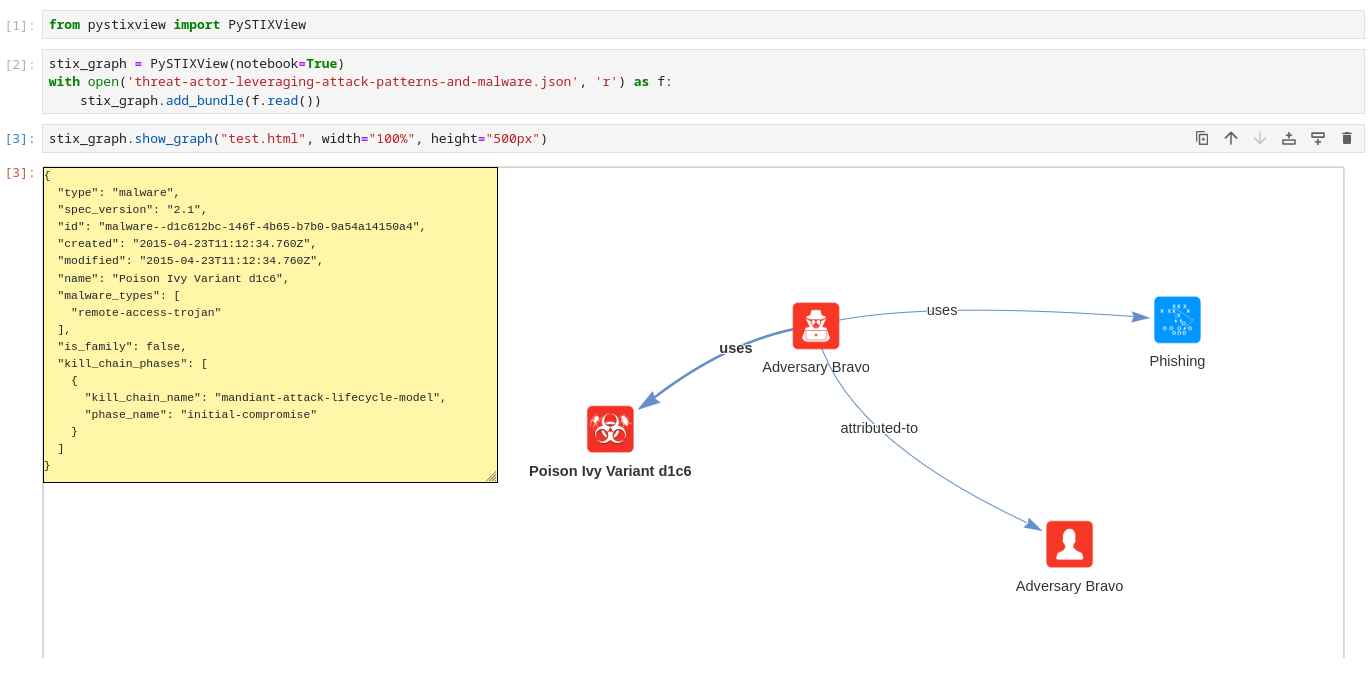
stix_graph.save_graph("threat-actor-leveraging-attack-patterns-and-malware.html", width="100%", height="600px")PySTIXView can be used also in Jupyter Notebook:
Documentation is available here
- The resources used for examples and library tests are taken from https://oasis-open.github.io/cti-documentation/stix/examples.html.
- The images used in the library for the node icons are taken from https://github.com/freetaxii/stix2-graphics

![dependabot[bot]](https://avatars.githubusercontent.com/u/49699333?size=120)