Grad: aggregate, store, query and visualize your metrics, all in one tool
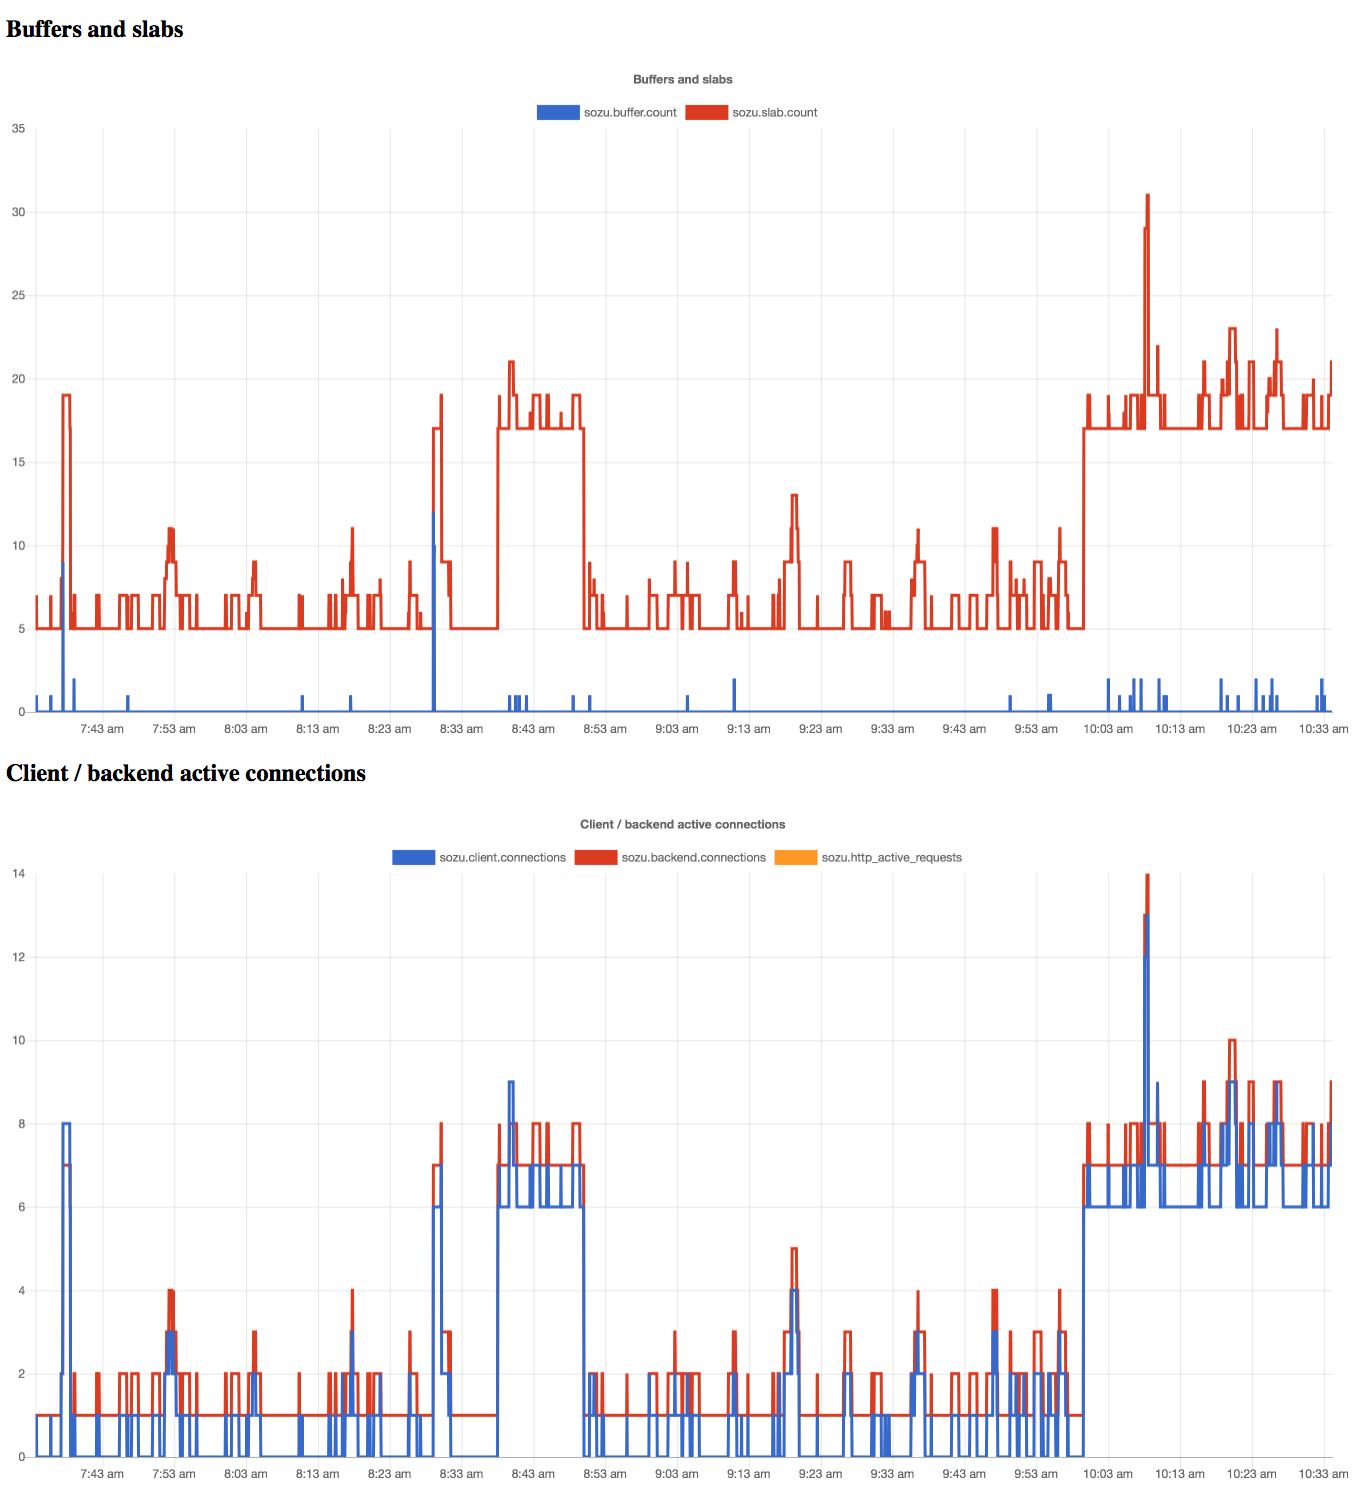
Grad is meant to quickly and painlessly get metrics from your services and display them, by running only one service, instead of setting up an aggregator, a time series DB and a graph web application.
Warning: early stage software
This application is a proof of concept for now, already usable for debugging sessions, but still lacking in features and performance.
How it works
It gets statsd compatible (with InfluxDB tags support) metrics from UDP and stores them in memory.
Graphs are defined from a JSON file stored in the configuration directory,
and accessible from this URL: http://localhost:3000/?dashboard=graph.json
Those configuration files follow this format:
{
  "title": "sozu",
  "graphs": [
    {
      "id": "requests",
      "title": "HTTP requests",
      "series": [
        "sozu.http.requests",
        "sozu.http.status.2xx",
        "sozu.http.status.3xx",
        "sozu.http.status.4xx",
        "sozu.http.status.5xx"
      ]
    },
    {
      "id": "protocols",
      "title": "Protocols",
      "series": [
        "sozu.protocol.http",
        "sozu.protocol.https",
        "sozu.protocol.tls_handshake"
      ]
    }
  ]
}
A page listing the available metrics is also exposed at
http://localhost:3000/series
License
Copyright (C) 2018 Geoffroy Couprie
This program is free software: you can redistribute it and/or modify it under the terms of the GNU Affero General Public License as published by the Free Software Foundation, version 3.
This program is distributed in the hope that it will be useful, but WITHOUT ANY WARRANTY; without even the implied warranty of MERCHANTABILITY or FITNESS FOR A PARTICULAR PURPOSE. See the GNU Affero General Public License for more details.

