GMXvg is a command-line utility designed for converting and plotting GROMACS XVG files. It simplifies the process of handling XVG files by automatically discovering all XVG files in the current or subdirectories and converting them to specified file formats, with JPG as the default format. Additionally, GMXvg logs the summary of plots in a CSV file, providing quick access to plot values along with their standard deviation.
- Automatically discovers and converts GROMACS XVG files.
- Supports conversion to multiple file formats (e.g., JPG, PNG, PDF).
- Logs plot summaries in a CSV file for easy access to plot values and standard deviations.
- Provides options to customize plot titles, legends, and other outputs.
- Merge multiple plots
Install using pypi or other directly from source using python's pip module:
- Install using:
pip install gmxvg - Check Version:
gmxvg --version - Help options:
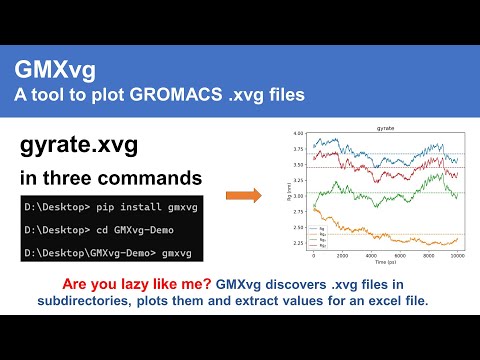
gmxvg -h - Video tutorial or demo
- Example CSV output

GMXvg is developed and tested for Ubuntu (20, 22, 24) and Windows (10, 11) environments. However, it is expected to work on all Windows, Linux, and macOS platforms.
-
gmxvg --<key>=<value>: Double dash separated by equal sign -
gmxvg -<key> <val1> <val2> <val3>Single dash (single dash is not recommended) and multiple values
Use gmxvg -h to see all options.
-
path_base: Base path if running from different directory -
csv_filename: File name for CSV output else default will be used -
csv_filepath: Path where CSV output file will be stored -
path_move: Path where generated images will be moved (images will be deleted from the dir where XVG are stored) -
path_copy: Path where generated images will be copied (source graphics will NOT be deleted) -
pattern_xvg: Pattern to specify XVG images for conversion e.g., *--new.xvg, -RMSD.xvg (Helpful when you want to convert some selected files) -
merge_patterns: Pattern to select XVGs to group their output e.g., Protein-*-RMSD.xvg (This will merge file names matching the pattern into single graph for comparative visualisation) -
export_ext: Type of outputs, e.g., JPEG, PNG, JPG, PDF (Any output format supported by Matplotlib) -
dpi: Resolution of the output, e.g., 72 for quick visualisation and 600 for standard publications -
flag_plot_mean: yes|no; Use yes to enable plotting average value line -
flag_plot_std: yes|no; Use yes to enable plotting standard deviation line -
flag_export_csv: yes|no; If results should be exported in a CSV file (includes directory name, file name, average of lines plotted and their standard deviation) -
flag_export_plot: yes|no; To specify if graphics should be exported or not (in case only values are needed)
- Download GMXvg executable file (Windows 10/11) and copy/paste the exe file in the directory where XVGs are contained. It will discover all xvg extension files in current or child folders and process them automatically.
gmxvg --path_base <path-to-dir-containing-xvg-files>
gmxvg --dpi 96 300 600 --path_copy <path-to-aggregate-results-outside>
gmxvg --path_copy <path-to-aggregate-results-outside>
gmxvg --export_ext JPEG pdf
- To merge multiple xvg files having ending (e.g., /complex1/lig.xvg, /complex2/lig.xvg, /complex3/lig.xvg) passed to
--merge_patterns RMSD.xvgso that it will combine all to plot one file.--uid_part -1parameter can be useful to define the Legend of the merged graphs.
gmxvg --merge_patterns RMSD-of-Ligand.xvg RMSD-of-Protein-C-Alpha.xvg Gyration-of-Protein.xvg NPT-Temperature.xvg Inter-Ligand-Protein-H-Bonds.xvg
- Example to merge Protein-RMSD.xvg and Ligand-RMSD.xvg files in the same directory.
gmxvg --merge_patterns RMSD.xvg --uid_part -1
- Use
-replacementsoptions to replace any text in the plot will change the labels and legends of the plotgmxvg --replacements "Receptor1--Lig2":p53-miR5 "Recptor2--Lig3":p53-miR3
GMXvg is open-source and welcomes contributions. Future plans include:
- GUI or web interface for interactive visualization.
- Customizable labels and text through GUI.
- Fast and efficient executable.
For development and contributions, fork the repository or create a pull request.
- The code is free to use by students, scholars, and professors.
- If you find the work useful and want to provide credit, you can cite the source code using DOI:10.5281/zenodo.6563931.
If you encounter installation issues, try using the pip cache purge command pip cache purge.


