Set of tools for AA and AB tests, sample size estimation, confidence intervals estimation. For continuous and discrete variables.
pip install abtoolkit
from abtoolkit.continuous.utils import estimate_sample_size_by_mde

estimate_sample_size_by_mde(
    std=variable.std(),
    alpha=alpha_level,
    power=power,
    mde=mde,
    alternative="two-sided"
)
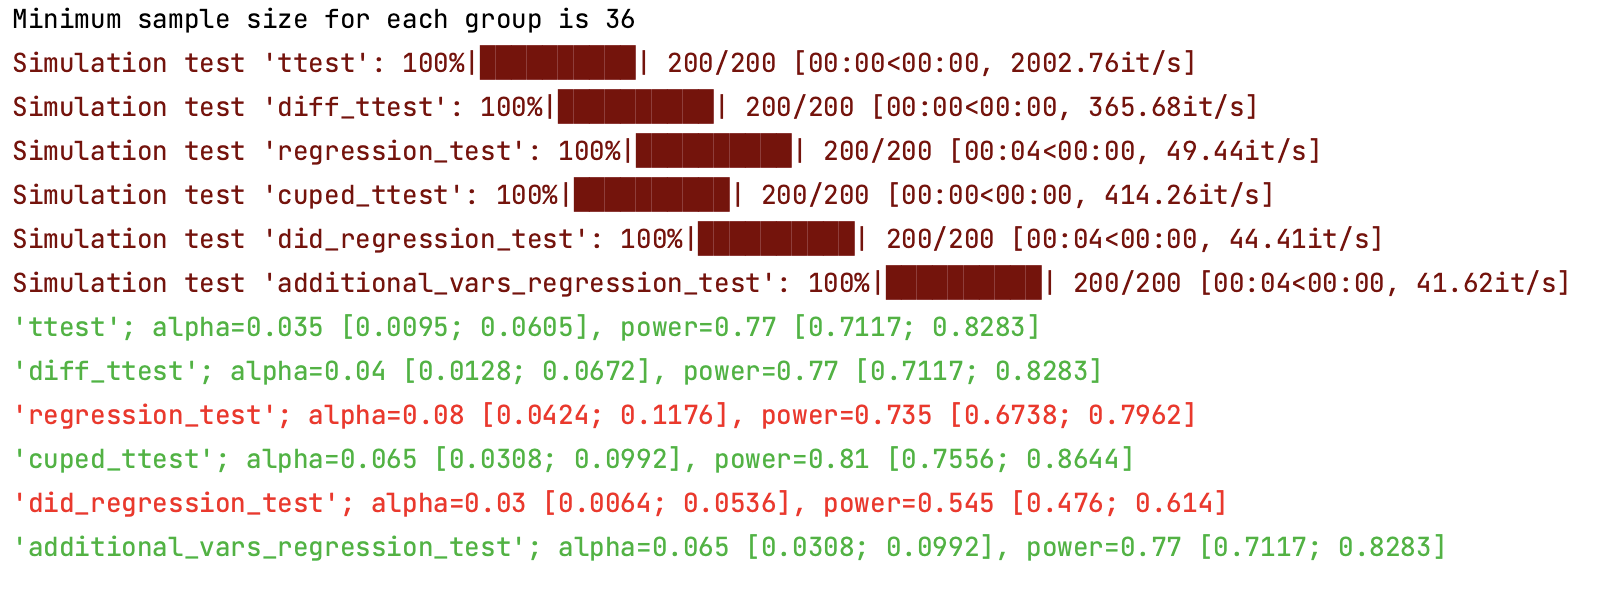
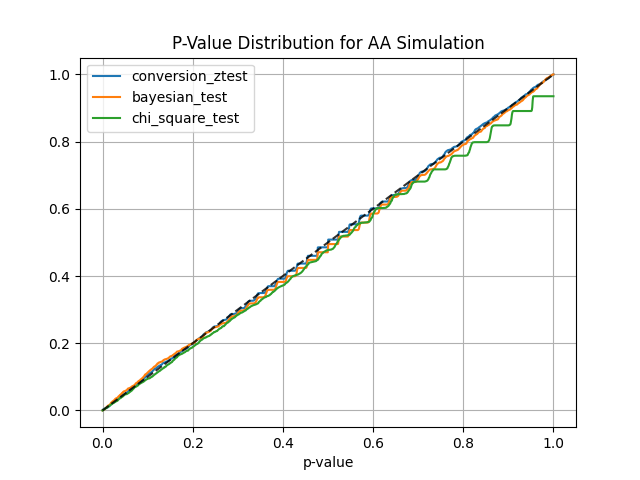
Using abtoolkit.continuous.simulation.StatTestsSimulation class you can simulate and check different stat-test,
compare them in terms of stat test power to choose the best test for your data. As result of simulation for each
stat test you will get the 1-st Type error estimation with confidence interval, 2-nd Type error estimation with
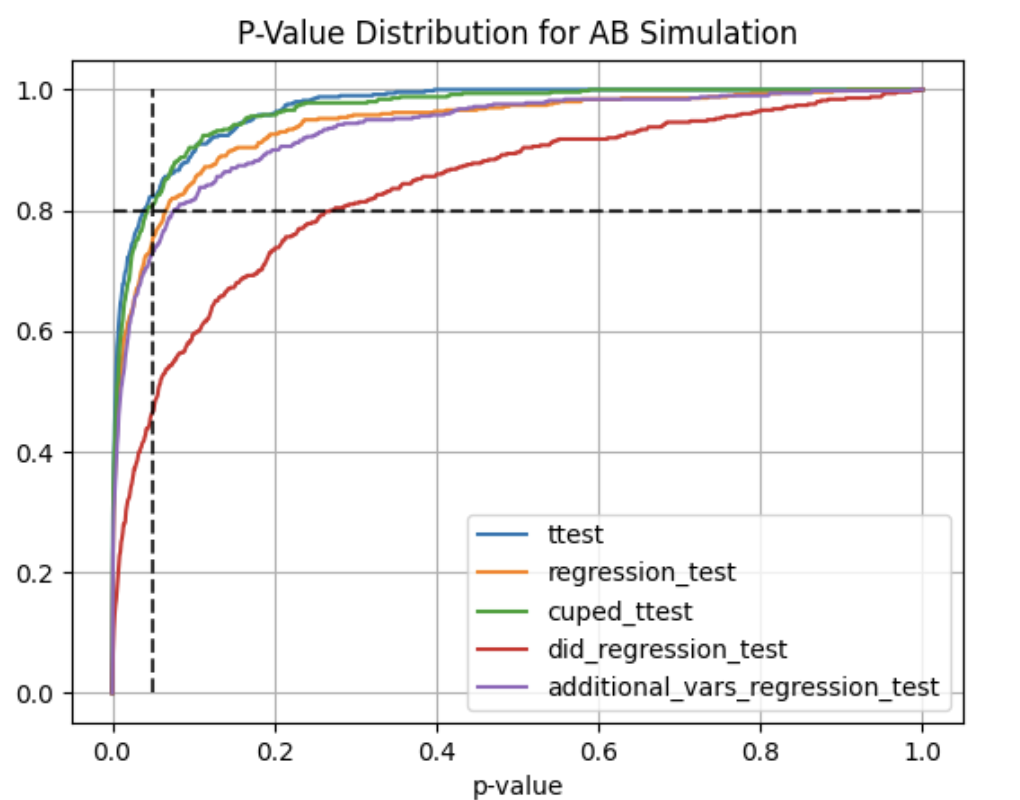
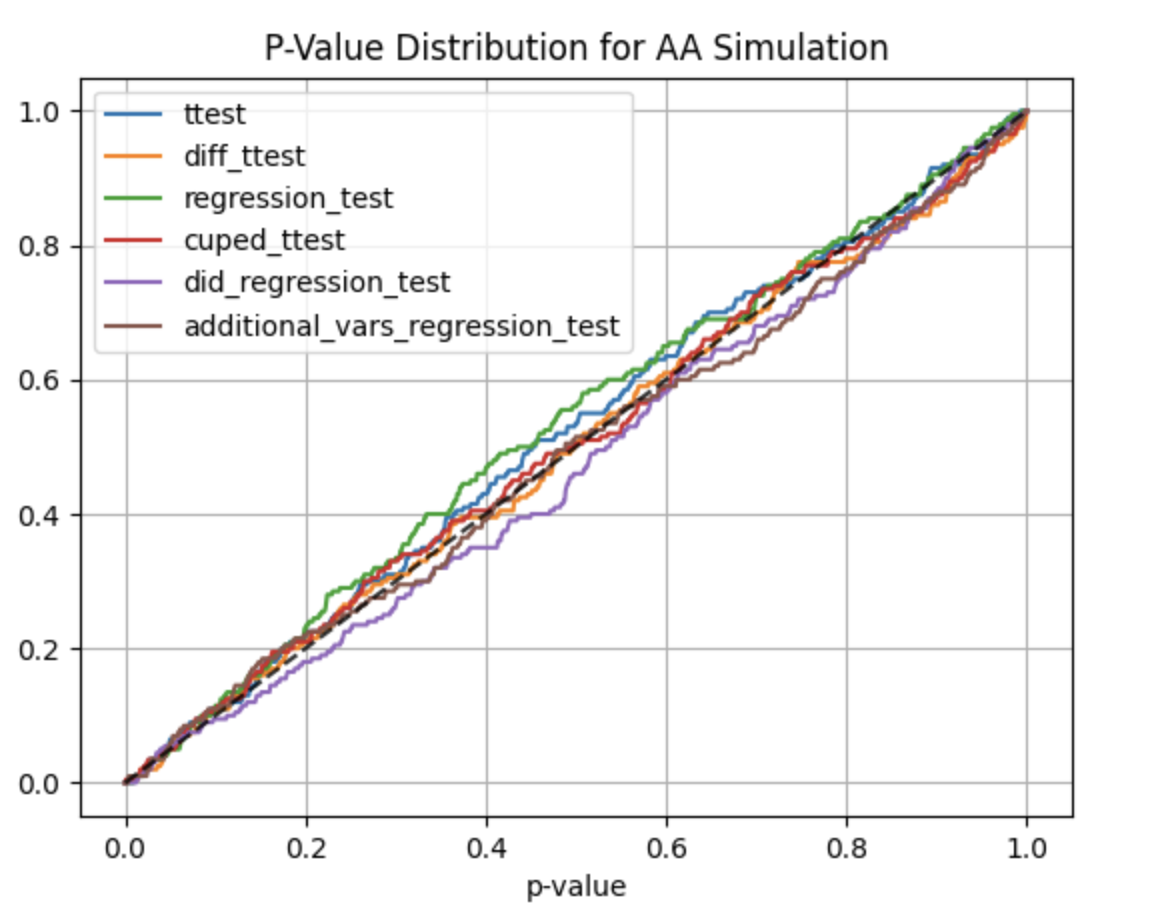
confidence interval and plot of p-value distribution for different tests.
from abtoolkit.continuous.simulation import StatTestsSimulation
simulation = StatTestsSimulation(
        variable,

        stattests_list=["ttest", "diff_ttest", "regression_test", "cuped_ttest", "did_regression_test",
                        "additional_vars_regression_test"],

        alternative=alternative,
        experiments_num=experiments_num,
        sample_size=sample_size,
        mde=mde,
        alpha_level=alpha_level,

        previous_values=previous_value,
        cuped_covariant=previous_value,
        additional_vars=[previous_value],
    )
simulation.run()  # Run simulation
simulation.print_results()  # Print results of simulation
simulation.plot_p_values()  # Plot p-values distribution
Output:
Full example of usage you can find in examples/continuous_var_analysis.py script.
- T-Test - estimates treatment effect by comparing variables between test and control groups.
- Difference T-Test - estimates treatment effect by comparing difference between actual and previous values of variables in test and control groups.
-
Regression Test - estimates treatment effect using linear regression by tested predicting variable.
Fact of treatment represented in model as binary flag (treated or not). Weight for this flag show significant
of treatment impact.
y = bias + w * treated -
Regression Difference-in-Difference Test - estimates treatment effect using linear regression by predicting
difference between test and control groups whist represented as difference between current variable value and
previous period variable value (two differences). Weight for treated and current variable values shows
significant of treatment.
y = bias + w0 * treated + w1 * after + w2 * treated * after -
CUPED - estimates treatment effect by comparing variables between test and control groups and uses covariant
to reduce variance and speedup test.
y = y - Q * covariant, whereQ = cov(y, covariant) / var(covariant). Cuped variable has same mean value (unbiased), but smaller variance, that speedup test. -
Regression with Additional Variables - estimates treatment effect using linear regression by predicting
tested variable with additional variables, which describe part of main variable variance and speedup test.
Fact of treatment represented in model as binary flag (treated or not). Weight for this flag show significant
of treatment impact.
y = bias + w0 * treated + w1 * additional_variable1 + w2 * additional_variable2 + ...
from abtoolkit.discrete.utils import estimate_sample_size_by_mde

estimate_sample_size_by_mde(
    p,
    sample_size,
    alpha=0.05,
    alternative="two-sided"
)
from abtoolkit.discrete.simulation import StatTestsSimulation

sim = StatTestsSimulation(
        count=variable.sum(),
        objects_num=variable.count(),
        stattests_list=["conversion_ztest"],
        alternative=alternative,
        experiments_num=experiments_num,  # Run each stattest 10 times
        sample_size=sample_size,  # Take 50 samples from variables
        mde=mde,  # Trying to detect this effect (very big for our simulated data)
        alpha_level=alpha_level,  # Fix alpha level on 5%
    )
    info = sim.run()  # Get dictionary with information about tests
    sim.print_results()  # Print results of simulation
    sim.plot_p_values()  # Plot p-values distribution
Output:
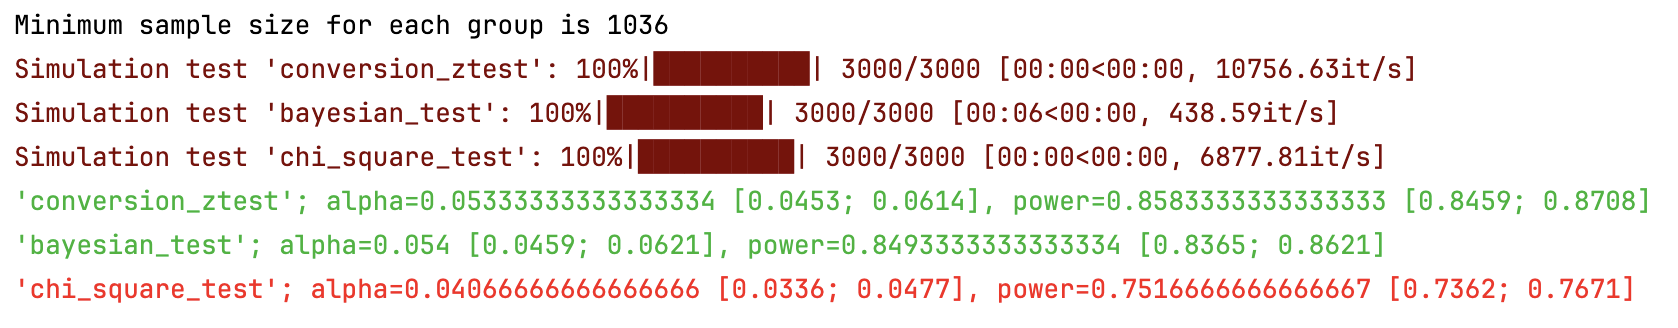
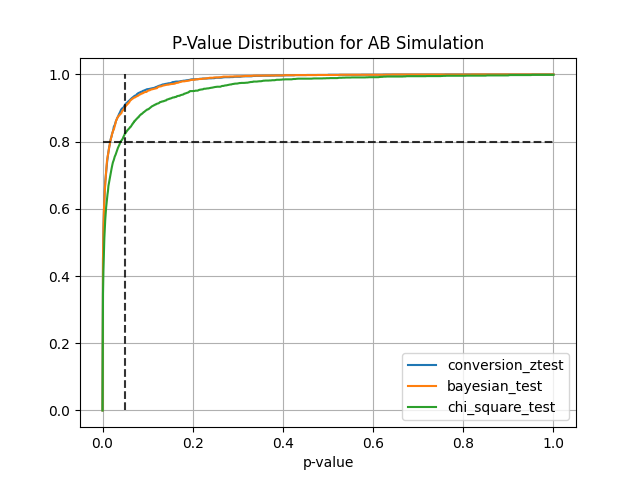
- Conversion Z-Test estimates treatment effect on conversion variable using z-test
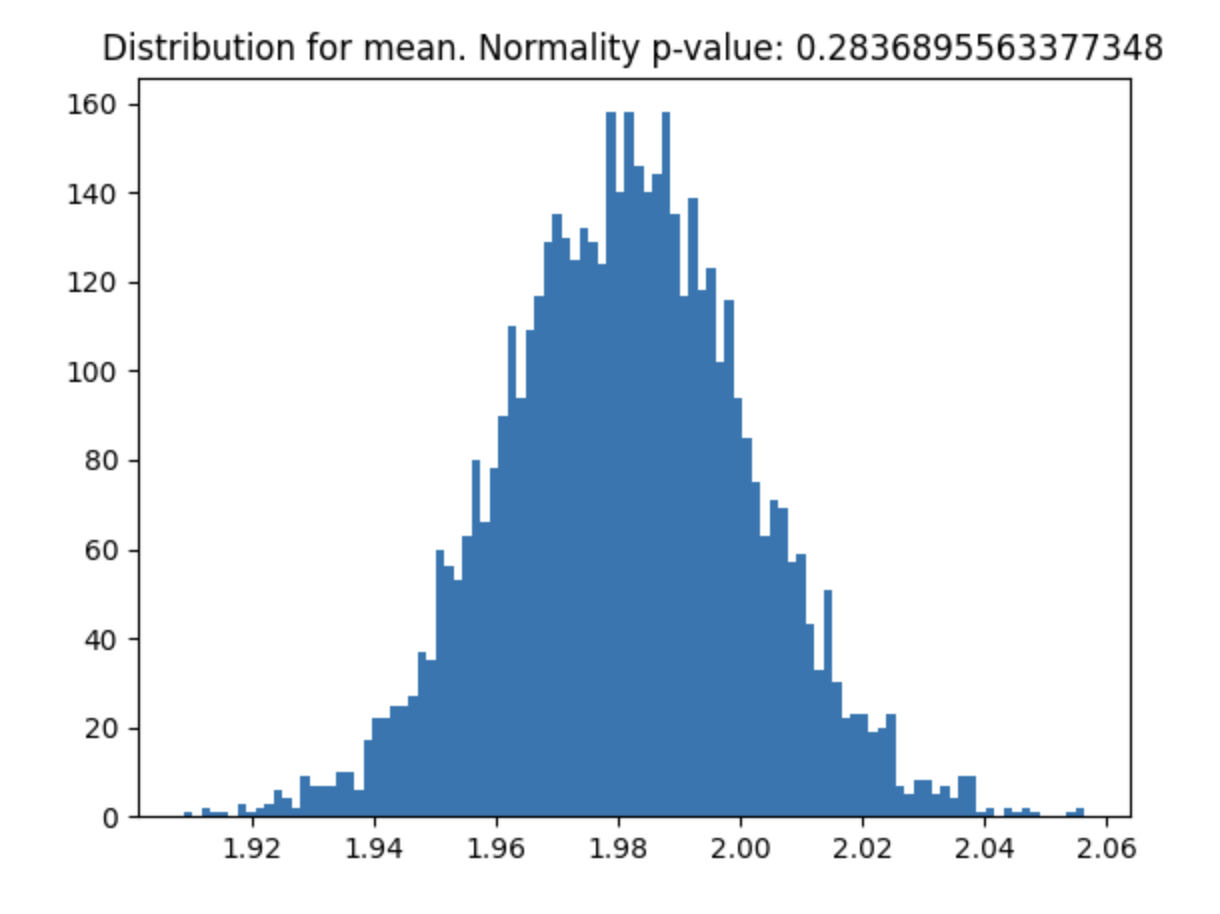
Helps you check if your variable meets the Central Limit Theorem and what sample size you need for it to meet.
from abtoolkit.utils import check_clt
import numpy as np

var = np.random.chisquare(df=2, size=10000)
p_value = check_clt(var, do_plot_distribution=True)
You can find examples of toolkit usage in examples/ directory.
