blitzcurve
Data analysis of time-resolved fluorescence anisotropy measurements (TRAMs).
TRAMs are state-of-the-art techniques that can be used to analyse protein function and interaction.
Why use TRAM techniques?
To measure molecule rotation speeds (e.g. protein size, structure, ligand binding).
To measure oligomerisation properties, via Foerster Resonance Energy Transfer (FRET) between two fluorescent molecules.
What is blitzcurve for?
- fitting curves to experimental TRAM data
- extracting useful fit parameters
- comparing samples
How does the experiment work?
- excitation of fluorescent molecules
- measurement of the depolorisation of the emitted light (polarisation / anisotropy)
- time-resolved methods: pulse excitation, and measurement of the change in anisotropy over time in nanoseconds
Analysis methods
- appropriate fitting methods are still under development
- current input: csv with anisotropy and time (ns) values
-
- current fitting methods for anisotropy vs time
-
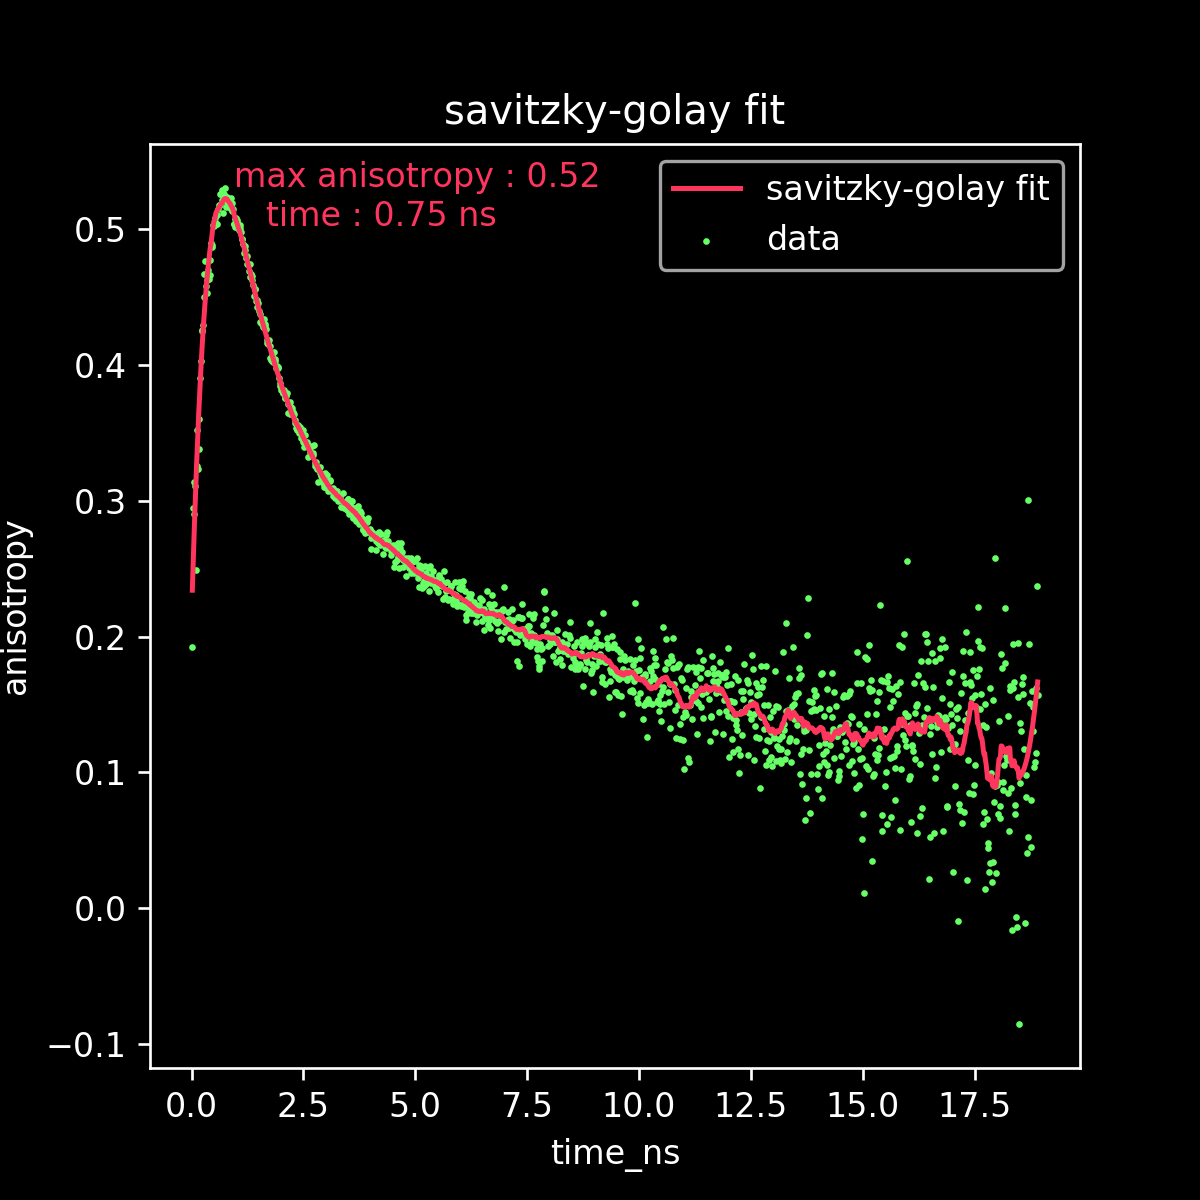
- Savitzky Golay fit to all raw data
- Exponential fit to initial decay data
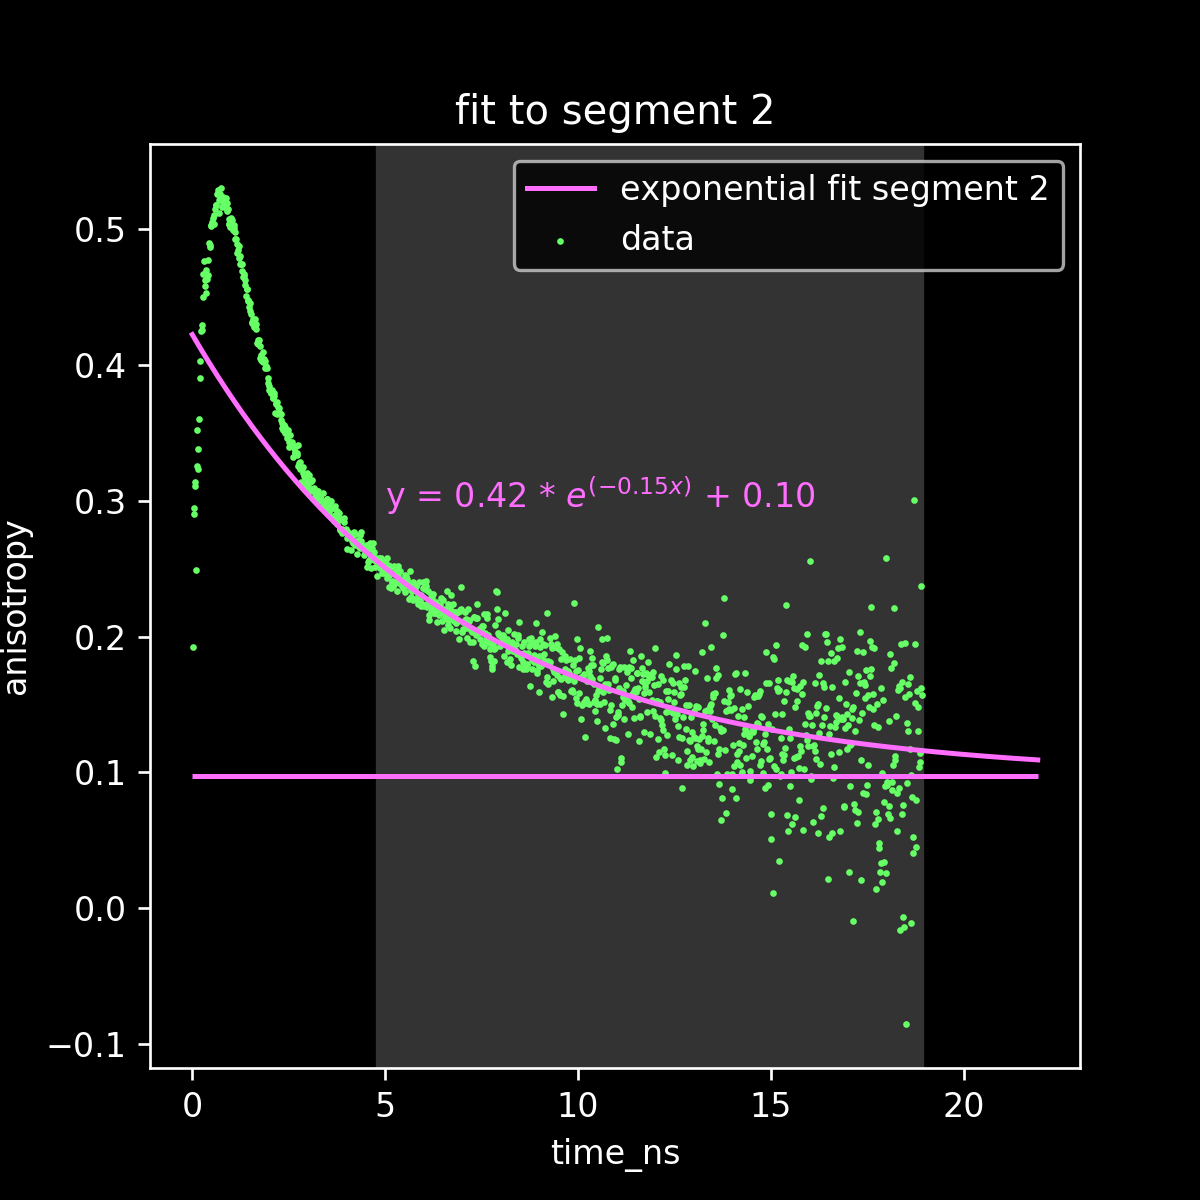
- Exponential fit to final decay data
-
- key measured parameters:
-
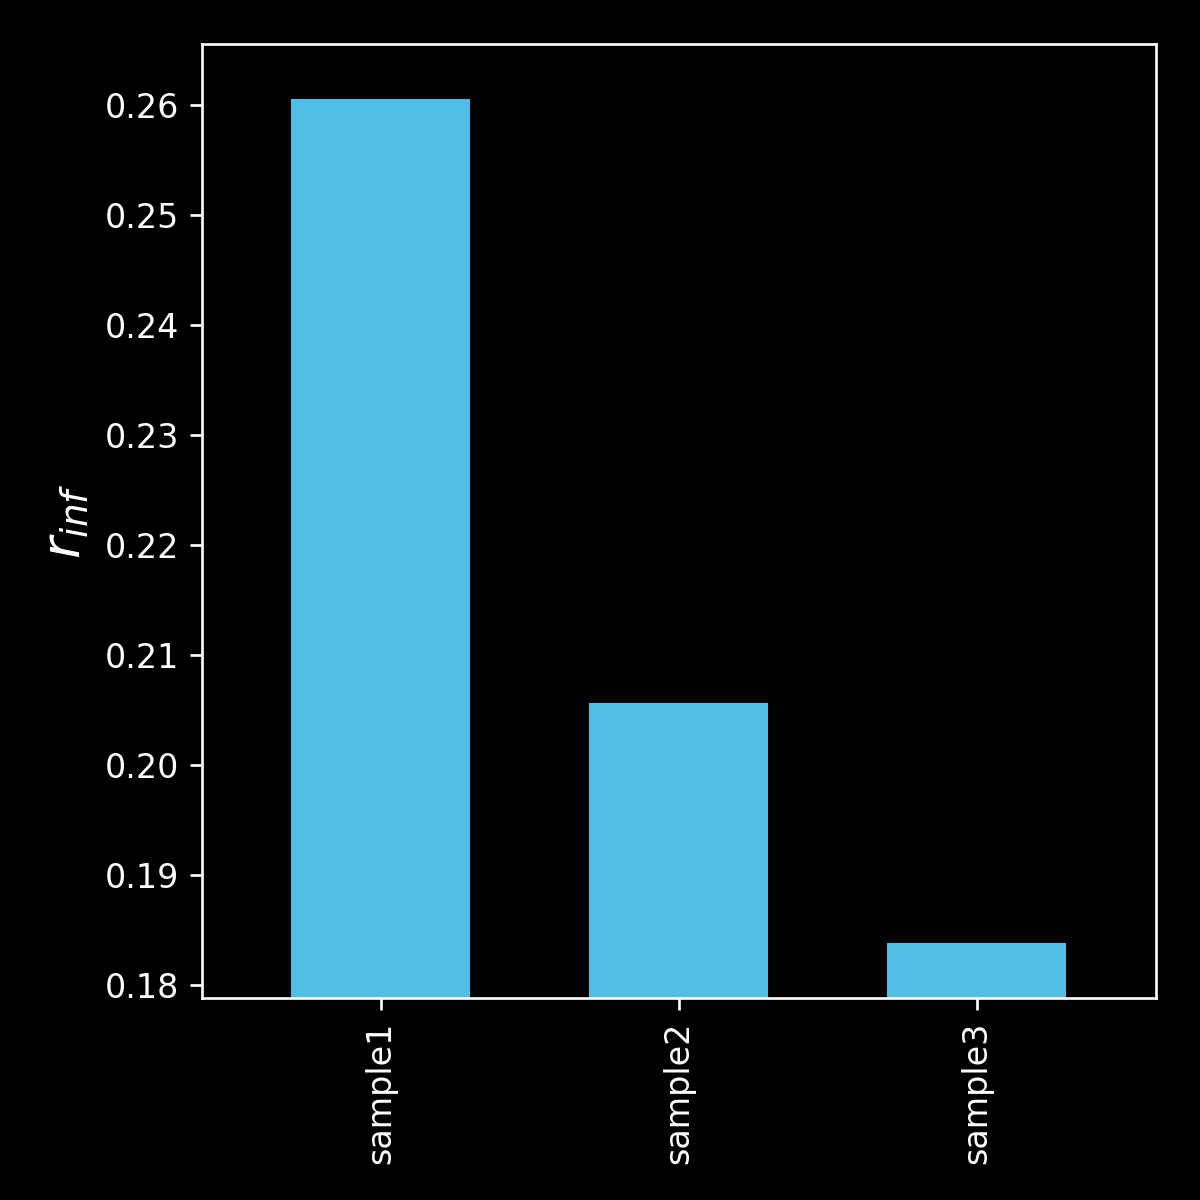
- r_inf (predicted anisotropy at an infinite range in time)
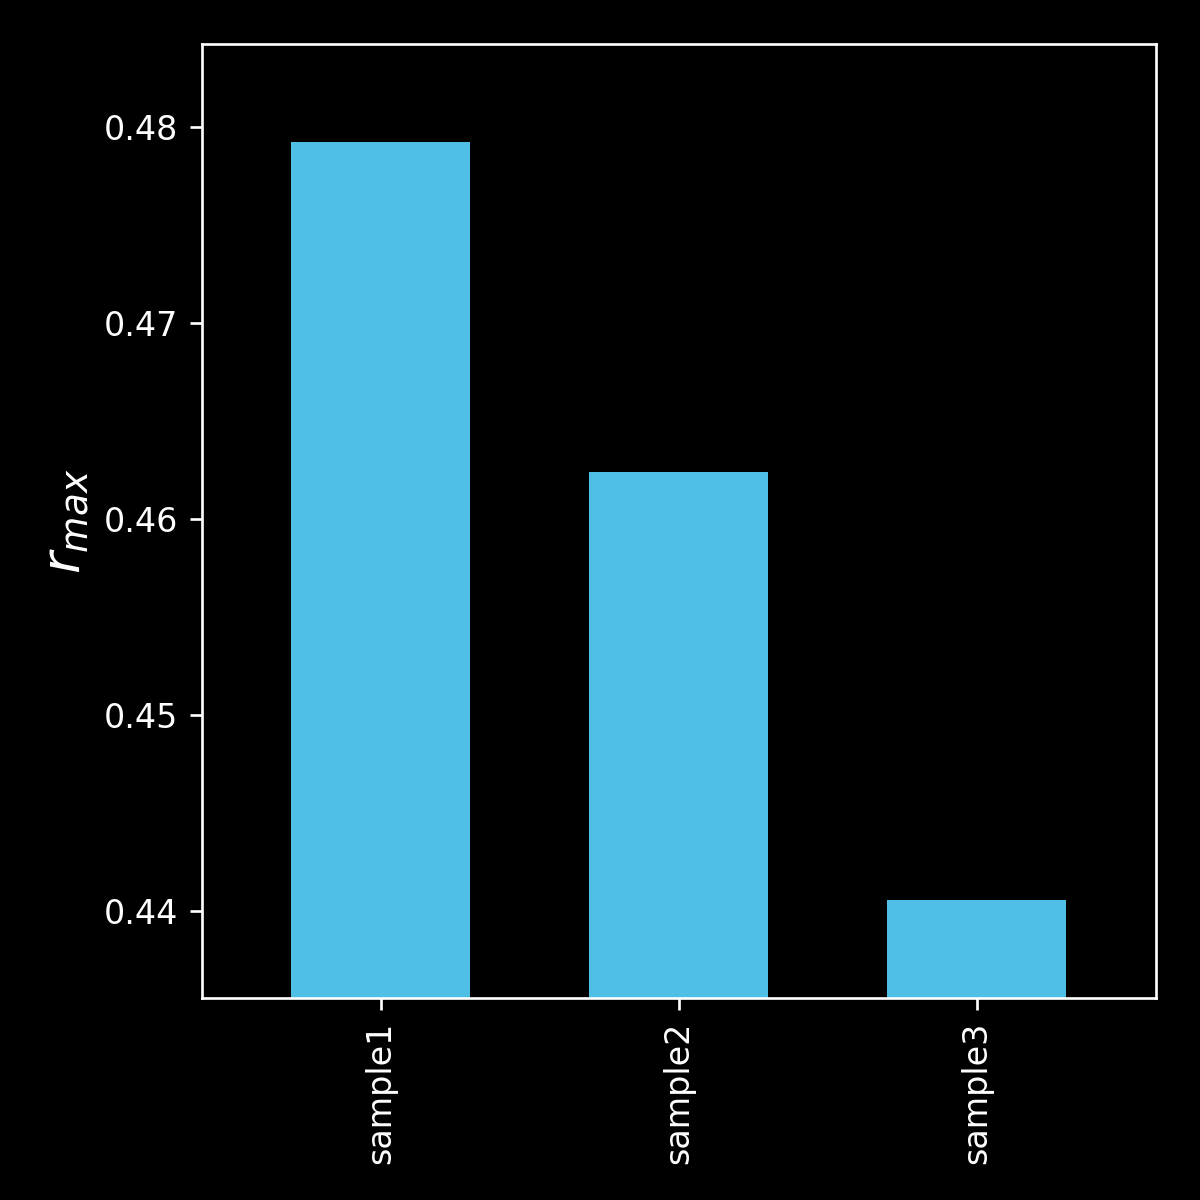
- r_max (maximum anisotropy measured at any timepoint)
Installation
pip install blitzcurve
- Blitzcurve should be compatable with Anaconda python 3.x or any scientific python package
Usage
import blitzcurve
# define data directory with csv files
data_dir = r"D:\data\20180229_TRdata"
# OPTIONAL: define which data files will be analysed
file_list = ["10nM-FGC1-2min_aniso.txt", "10nM-FGC2-2min_aniso.txt"]
# run blitzcurve function to fit curves to individual samples
blitzcurve.run_fit(data_dir, figs_to_plot=file_list)
# setup a dictionary to shorten long sample names
name_dict = {"10nM-FGC1-2min_aniso.txt": "FGC1", "10nM-FGC2-2min_aniso.txt": "FGC2", "10nM-FGC3-2min_aniso.txt": "FGC3"}
# run blitzcurve function to compare curves and parameters for multiple samples
blitzcurve.run_compare(data_dir, name_dict=name_dict)
Contribute
Collaborators and pull requests are welcome. Send us an email.
License
This python package is released under the permissive MIT license.
Contact
Contact details are available at the staff pages of Mark Teese or Philipp Heckmeier within the Langosch lab of the Technical University of Munich.

Examples
fit to obtain r_max
fit to obtain r_inf
barchart comparing r_max
barchart comparing r_inf
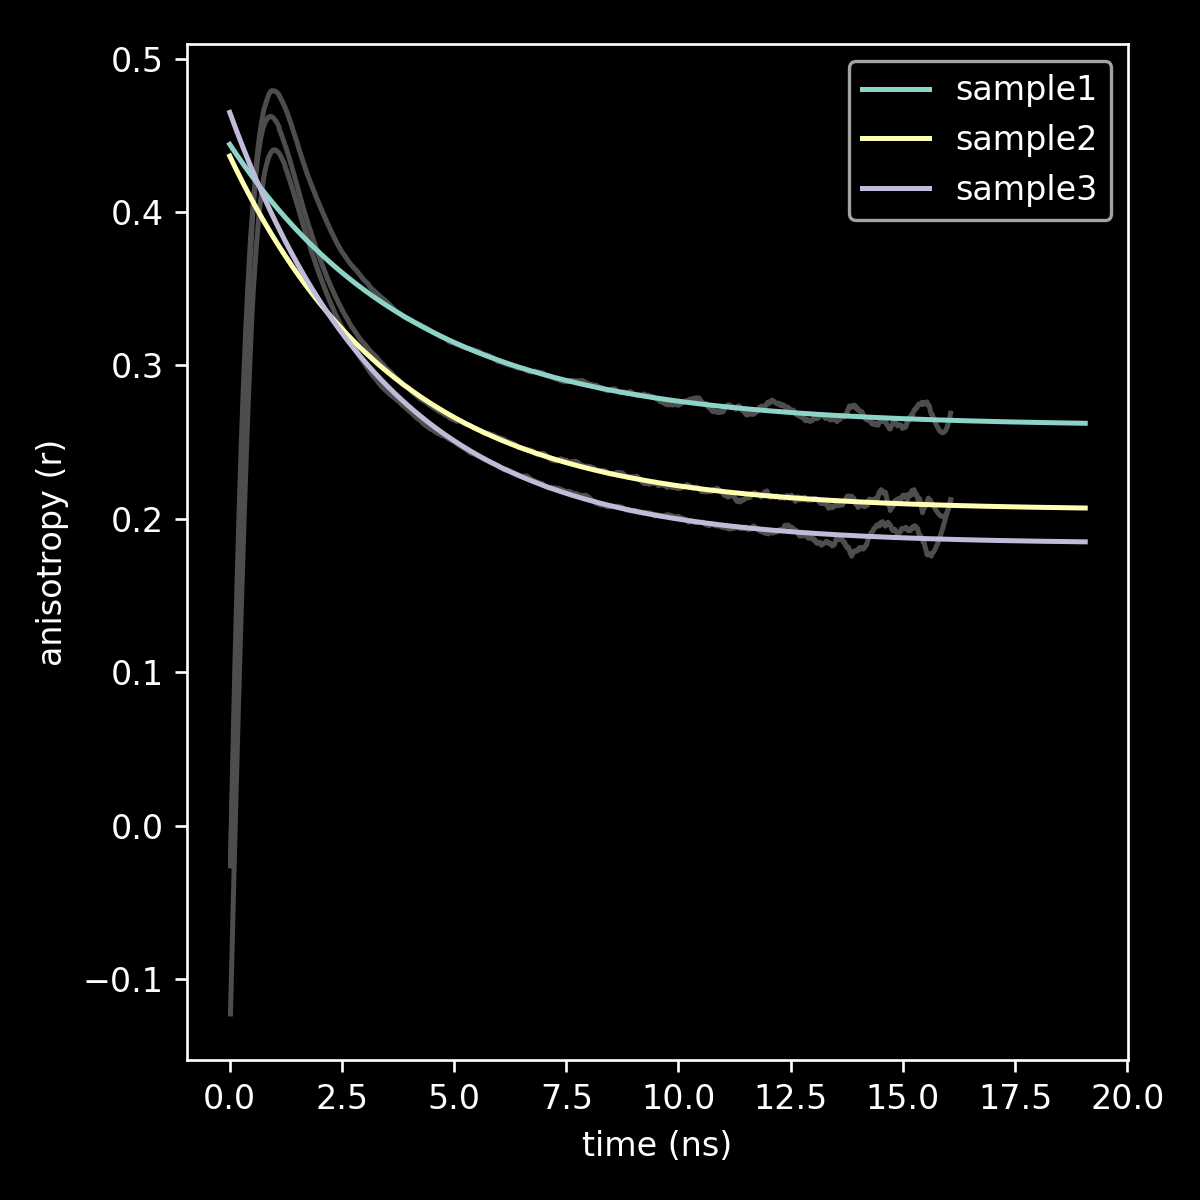
linechart comparing fit to full data for three samples
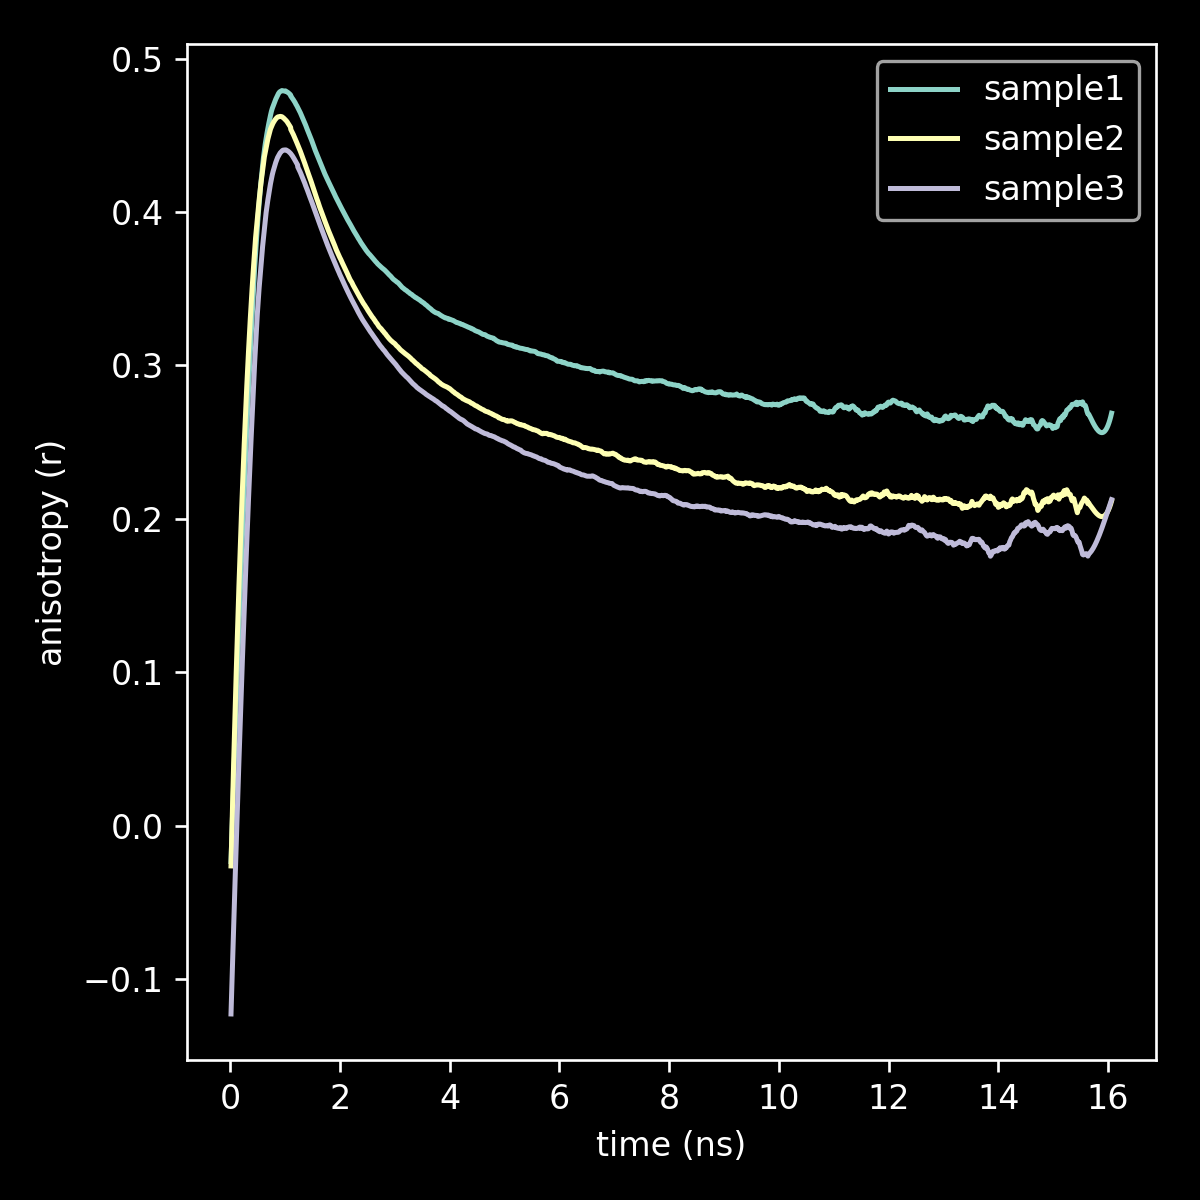
linechart comparing fit to r_inf for three samples