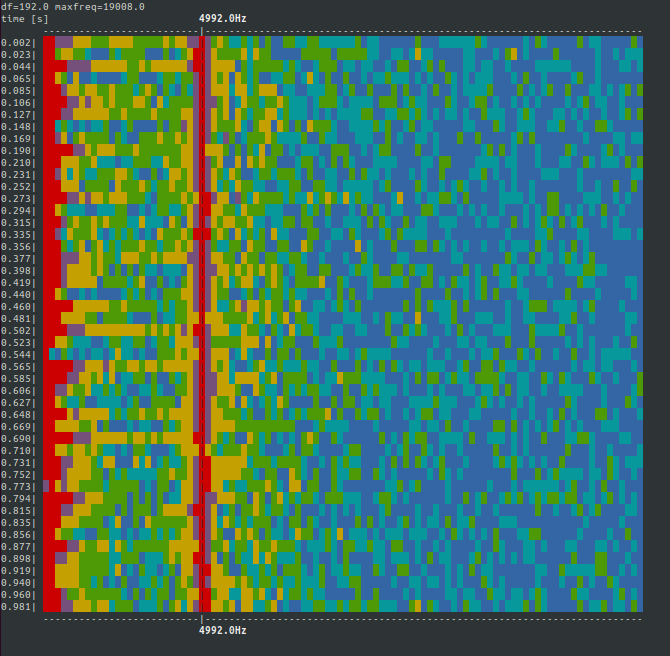
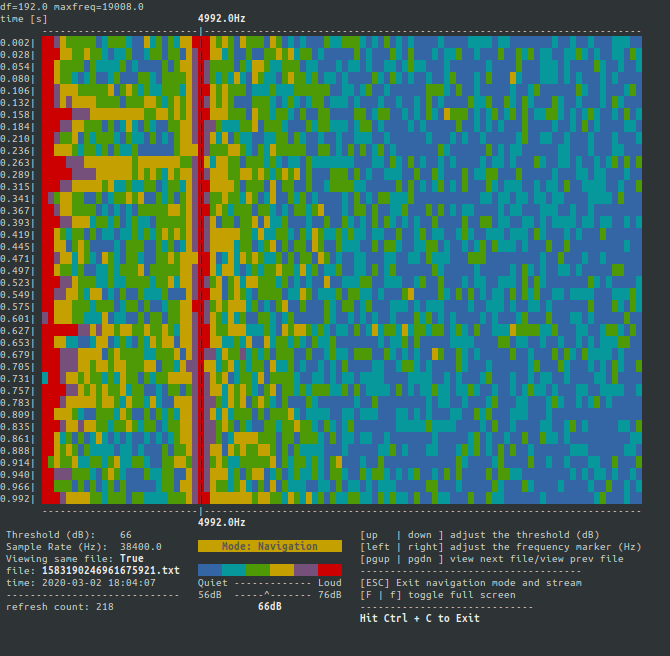
Command Line Interface Spectrogram
cli-spectrogram
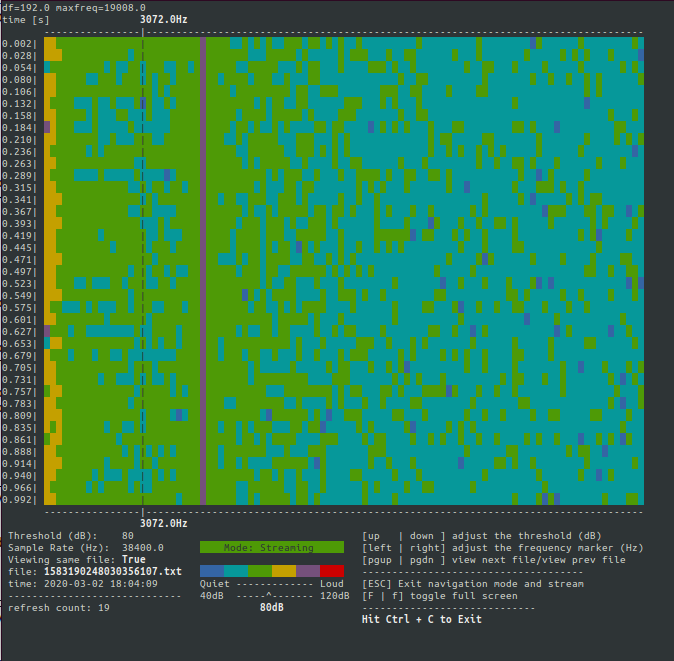
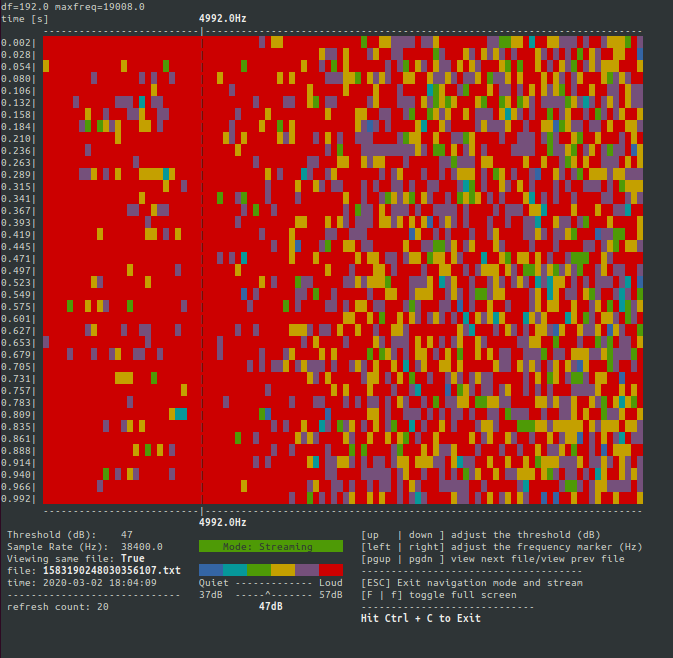
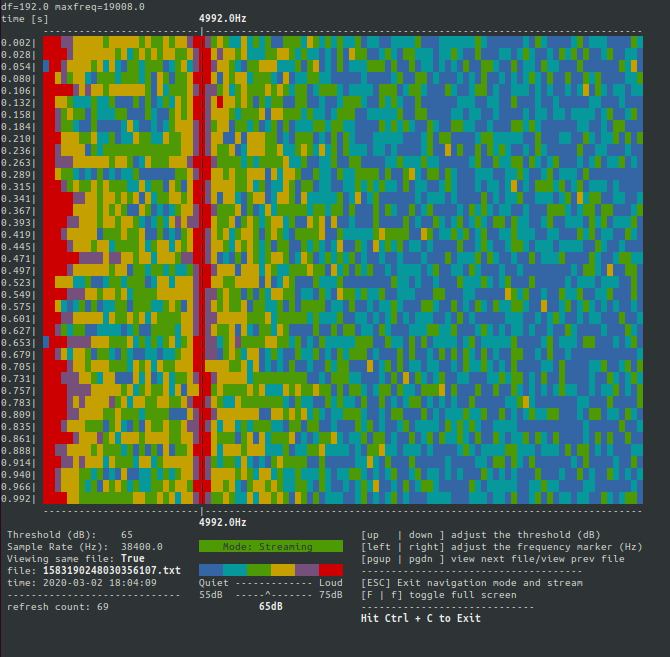
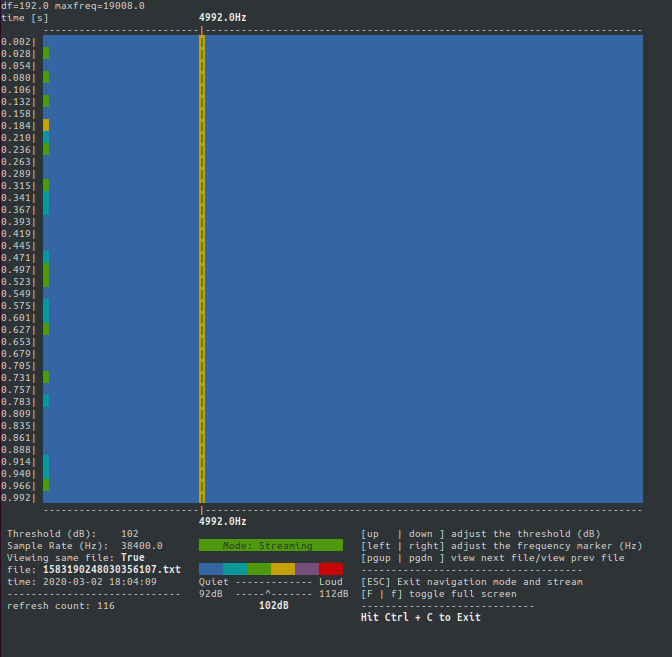
Simple python module that creates spectrograms from multi channel hydrophone array data in the command line.
Purpose
Our group needed a lightweight, command line tool to look at spectrogram data coming from multi channel hydrophone arrays. This was designed for text or binary files created using the uldaq library. Link to their source code here.
Example data file with two channels
The first column contains voltage readings from channel 1 The second column contains voltage readings from channel 2 The data points are separated by ','
0.001782, 0.002414
0.002414, 0.002414
0.001641, -0.001416
0.000060, -0.001416
-0.001416, -0.001416
-0.001908, -0.001100
-0.001100, -0.001100
Installing cli-spectrogram
cli-spectrogram is meant to be a standalone tool.
$ pip install cli-spectrogram
Running cli-spectrogram
$ cli_spectrogram --sample-rate 38400 --file-length 1 --source ./examples
$ cli_spectrogram --help

usage: cli_spectrogram [-h] --sample-rate SAMPLE_RATE --file-length
                       FILE_LENGTH [-d] [--source SOURCE]
                       [--threshold-steps THRESHOLD_STEPS]
                       [-c {1,2,3,4,5,6,7,8}] [-t THRESHOLD_DB]
                       [-m MARKFREQ_HZ] [--nfft NFFT]

optional arguments:
  -h, --help            show this help message and exit
  --sample-rate SAMPLE_RATE
  --file-length FILE_LENGTH
                        in seconds
  -d, --debug           Show debugging print messsages
  --source SOURCE       Source directory with .txt files
  --threshold-steps THRESHOLD_STEPS
                        How many dB above and below threshold
  -c {1,2,3,4,5,6,7,8}, --display-channel {1,2,3,4,5,6,7,8}
  -t THRESHOLD_DB, --threshold-db THRESHOLD_DB
  -m MARKFREQ_HZ, --markfreq-hz MARKFREQ_HZ
  --nfft NFFT
Different ways to launch cli-spectrogram
$ cli_spectrogram --sample-rate 38400 --file-length 1 --source ./examples
$ cli_spectrogram --sample-rate 38400 --file-length 1 --source ./examples --markfreq-hz 2000 --threshold-db 80
$ cli_spectrogram --sample-rate 38400 --file-length 1 --source ./examples --markfreq-hz 2000 --threshold-db 80 --threshold-steps 20
Navigating the user interface
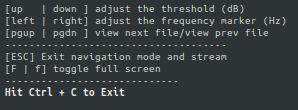
Adjust the Threshold (dB)
- press the 'up arrow' to increase the threshold dB value by
THRESHOLD_STEPS. - press the 'down arrow' to decrease the threshold dB value by
THRESHOLD_STEPS.
Adjust the Mark Frequency
- press the 'right arrow' to increase the mark frequency value by 200Hz.
- press the 'left arrow' to decrease the mark frequency value by 200Hz.
Toggle Full Screen
- press 'F' or 'f' to toggle full screen mode. In full screen mode there are more rows to the spectrogram but the menu and legend are hidden.
Navigation Mode
- press 'pg up' to display the next file. (if you're at the most current file, 'pg up' won't do anything).
- press 'pg down' to display the previous file. (if you're at the oldest file, 'pg down' won't do anything).
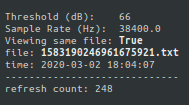
- press 'escape' to exit Navigation mode and return to streaming mode. Note: in Navigation mode, the spectrogram will be displayed for the current file and wait indefinitely. When Streaming mode is resumed, the spectrogram will be of the latest file, NOT where it left off.
Ui Indicators
Errors and fail states
- cli-spectrogram has a minimum console size. If you shrink the window past the minimum size, you'll be prompted to resize until the minimum dimensions are met.
- If there aren't any files in the log directory, you'll need to restart the cli-spectrogram and provide a directory to
--sourcethat has the text/binary files generated by the uldaq library; however, if files are added to the directory while in this state, cli-spectrogram will return to/start streaming.


