NB: must have geopandas installed otherwise errors are likely to occur, see here
1. Install
pip install crosswalktest
or
conda install -c nikbpetrov crosswalktest
conda recommended as installing geopandas is easier in anaconda - see here
2. Import
from crosswalktest import *
or
import crosswalktest as cw
[examples given with the latter, if the former is chosen, skip the 'cw.' prefix on the functions]
3. Use
3.1. crosswalk
cw.crosswalk(source_shape_or_filepath, source_shape_id, target_shape_or_filepath, target_shape_id,
				      source_population_col_id = None, source_col_id_to_weigh_by_population = None,
				      tolerance_percent = 10, tolerance_units = None,
				      export = False, export_filename = None)
3.1.1. Input
-
source_shape_or_filepath - Either a geopandas dataframe or a filepath to a
.shpfile that can be passed to thegeopandas.GeoDataFrame.from_filefunction (see here for details) - source_shape_id -> string; A column name that uniquely identifies each entry from the source shape
-
target_shape_or_filepath - Either a geopandas dataframe or a filepath to a
.shpfile that can be passed to thegeopandas.GeoDataFrame.from_filefunction (see here for details) - target_shape_id - string; A column name that uniquely identifies each entry from the target shape
- source_population_col_id - string; Optionally, provide a column name that holds the population count for each entry from your source shape
- source_col_id_to_weigh_by_population - string; Optionally, provide a column name that holds the variable that is going to be weighed by the population (details coming soon)
-
tolerance_percent - number; Percentage of the smallest area of either the source or the target shape areas to set as the minimum area allowed in the intersected shape. If
tolernace_unitsare set, then the value of this argument will be ignore and instead recalculated based on tolerance units (tolerance units divded by the smallest area of either the source or target shape) in the diagnostics. See 4.3. for details -
tolerance_units - number; Minimum shape area allowed in the intersected shape. If this argument is not set, it will be calculated based on
tolernace_percentset (smallest area from either the source or target shapes multipled by the tolerance percent). -
export - boolean; whether to export the intersected shape in a
.csvfile. Note that when a file is exported itsgeometrycolumn is dropped to save memory, time and preserve neat formatting. -
export_filename - If
exportis set to true, you can se the name of the to-be-exported.csvfile. It can be a filepath. Ifexportis set totrue, this agument will default to saving in the source file directory with a file formatcrosswalk_{time_now}.csv
3.1.2. Output
The function returns 2 values:
-
intersect - the intersection between the two files. The intersection contains all columns of the input source and target shapes as well as new columns:
- area_base_source - the area of each entry from the source shape
- area_base_target - the area of each entry from the target shape
- intersect_area - the area of each entry from the intersected shape
-
INTERSECT_ID - unique identifier for each entry in the intersected shape constructed in the format
{source_shape_id}_{target_shape_id} - weight - the proportion of the intersected shape area to the source shape area
-
intersect_population if
source_population_col_idis provided, this column's values will be calculated by multiplying thesource_population_col_idbyweight -
target_shape_population - if
source_population_col_idis provided, this column's values will contain the estimated target shape population based on theintersect_population, grouped bytarget_shape_id -
intersect_{source_col_id_to_weigh_by_population} - if
source_col_id_to_weigh_by_populationis provided, each entry from the intersect shape will have this column set as follows: multiply theweightby thesource_col_id_to_weigh_by_populationand then multiply the result by the proportion ofintersect_populationtotarget_shape_population. -
target_shape_{source_col_id_to_weigh_by_population} - if
source_col_id_to_weigh_by_populationis provided, this column's values will contain the estimated target shapecol_id_to_weigh_by_populationbased on theintersect_{col_id_to_weigh_by_population}, grouped bytarget_shape_id.
-
diagnostics_obj - an object containing diagnostics of the intersection. The below two functions can be used to get the information from the object (
print_diagnosticsandsave_diagnostics_to_word)
3.1.3. Example
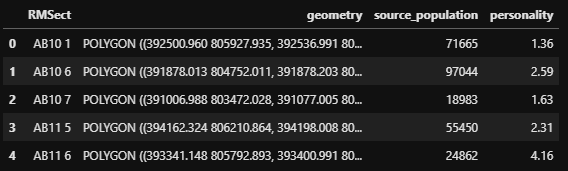
Here's how our source shape file might look like (some columns omitted for simplicity):
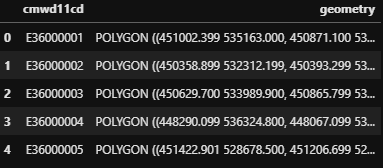
... and the target shape:
Thus, we can crosswalk these two shapes like this:
intersect, diagnostics_obj = cw.crosswalk(source_shape_or_filepath = source_shape, source_shape_id = 'RMSect',
              target_shape_or_filepath = target_shape, target_shape_id = 'cmwd11cd',
				      source_population_col_id = 'source_population', source_col_id_to_weigh_by_population = 'personality',
				      tolerance_percent = None, tolerance_units = 3500,
				      export = True, export_filename = 'source_to_target_crosswalk_example_1')
Notice how the tolerance is set to 3500 units while the tolerance percent is set to None (it might as well have been omitted as it will be recalculated based on the units). This is custom for these files.
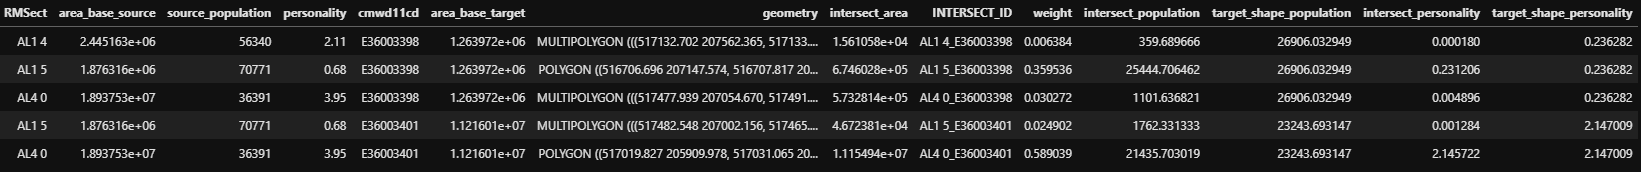
Thus, the result we get is a intersect object that looks like this (the exported .csv is the same without the geometry column) (some columns omitted for clarity):
and a diagnostics object that can be used for the following two functions...
3.2. print_diagnostics
cw.print_diagnostics(diagnostics_obj)3.2.1. Input
The diagnostics_obj returned by the crosswalk function.
3.2.2. Output
Readable diagnostics into your console.
3.2.3. Example
Printing the diagnostics for the object generated by the above function call... Some text is omitted for brevity.
cw.print_diagnostics(diagnostics_obj)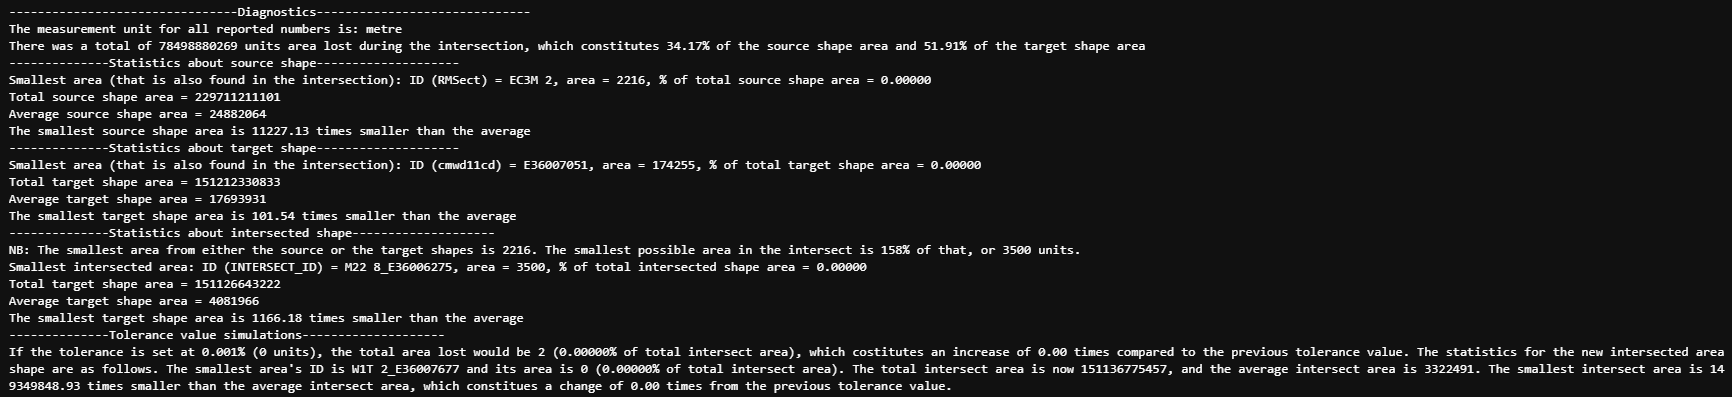
3.3. save_diagnostics_to_word
cw.save_diagnostics_to_word(diagnostics_obj, output_type, filename = None)3.3.1. Input
-
diagnostics_obj - returned by the
crosswalkfunction - output_type - either table or text (see the Example section for sample files)
-
filename - optional filename of the document to be saved. By default, the file will be saved in the same directory from which you run the script or filepath can be specified in the filename. If filename is not provided, the document's filename will be set to
crosswalk_diagnostics_{time_now}.docx
3.3.2. Output
Word file with diagnostics information.
3.3.3. Example
See 4.2. below for sample files and explanation.
4. Technical details
4.1. Projection units
It is necessary for projection units across the source and target shapes to match in order to intersect them (using geopandas' intersection fucntion, see here). Currently, the package will raise an error if projection units are differnet between the two shapes and will default to using the source shape's projection units (which are expected to be the same as the target's). Read more about projection units here.
4.2. Tolerance
Tolerance is a key concept in the crosswalk library. When intersecting two shapes, it is important to avoid intersections that are the result of computation margin of error and are not meaningful. In order to do that, we can set a minimum for the area that an entry in the intersected shape can contain.
There are two ways to do this: using percentage based on source and target shapes or raw units of area.
If percentage is chosen, that would be the percentage of the smallest area from either the source or target shapes. Imaging that the smallest area in the source shape is 10,000. When that area is intersected with any of the areas of the target shape (all of which area >10,000, say), then the smallest possible intersect we would want to allow is a % of 10,000. In this case if my tolerance_percent is set to 10, then the smallest possible area for an entry in the intersected shape would be 1,000.
But sometimes, if the source and target shapes contain drastically low entries, a percentage might not be restrictive enough for practical purposes. Hence, you can set the minimum area allowed in the intersected shape by setting the tolerance_units. If you decide to set tolerance_units, the respective tolerance_percent will be calculated for you in the diagnostics (and vice versa if you set tolerance_percent only). Note that if tolernace_units are set, tolernace_percent is ignored.
4.3. Diagnostics
The diagnostics information for each crosswalk is the same across viewing methods (whether you print_diagnostics in the console, save_diagnostics_to_word to table or text) and is only formatted slightly differently. The information is essentially divided in three sections, each of which reviewed in turn...
See here for an example of a word file containing text diagnostics (very similar to print_diagnostics output), and here for a file containing table diagnostics.
4.3.1. Diagnostics information: Statistics about shapes
The very first sentence will give information about the measurement unit for all reported numbers you will see. That will be derived from the projection units of the source and target shapes.
The next sentence will report how many units area are lost during the intersection and what percentage of the source and shape targets that represents. This is visualized at the bottom of the output in the 3rd section of the diagnostics, see 4.3.3.
You will then see 4 piece of information for each of the source, target and intersected shapes:
- Information about the smallest area, including the name of the column containing the unique identifier for each entry, the unique identifier of the smallest area, as well as the raw area of the smallest area and what percentage of the total respective shape area that represents.
- Total shape area
- Average shape area
- How many times the smallest shape area is smaller than the average
A note will also inform you how the smallest area from the intersected shape was found. This will be based on your entered tolerance. For more on tolerance, see 4.2.
4.3.2. Diagnostics information: Tolerance value simulations
In order to help users make better decisions about what level of tolerance fits best their case, this section reports statistics based on difference tolerance values.
There are 13 pre-set simulation values for the tolerance percent (0.001, 0.01, 0.05, 0.1, 0.5, 1, 5, 10, 20, 50, 90, 100, 150). An additional value may be added if the user-selected tolerance percent is not in this list (this could be either done by setting a different tolerance percent or by setting the tolerance units, which will calculate a new tolerance percent). For each simulation value, there are two sets of information: statistics about the area lost from the intersected shape based on the simulation value, and statistics about the new intersected shape if the respective tolerance value is used.
4.3.3. Diagnostics information: Source and target shapes visualisation
Within this section, three maps of each shape area are displayed. These can be used to verify that the input is as expected. The map of the overlaid source and target shape can be used to visualize what the intersected shape will be (that would be the area in brown).
