![]()

detroit is wrapper for Python of d3js and Observable Plot.
pip install detroitThen you will need to install a browser through the Python package playwright.
For the moment, only chromium is supported.
playwright install chromium- Write as close as possible
d3andPlotcode - Render one or multiple plots in your browser or in your jupyter notebook
- Customize style as you want
- Save them into
.svg,.pngor.pdf
import polars as pl
from sklearn.datasets import load_digits
from sklearn.decomposition import PCA
from sklearn.preprocessing import StandardScaler
from detroit import Plot, js, render, save
mnsit = load_digits()
scaler = StandardScaler()
X_scaled = scaler.fit_transform(mnsit.data)
pca = PCA(n_components=2)
components = pca.fit_transform(X_scaled)
# Prepare your data with Polars, Pandas or manually
df = pl.DataFrame(components, schema=["Component 1", "Component 2"])
df = df.insert_column(2, pl.Series("digit", mnsit.target))
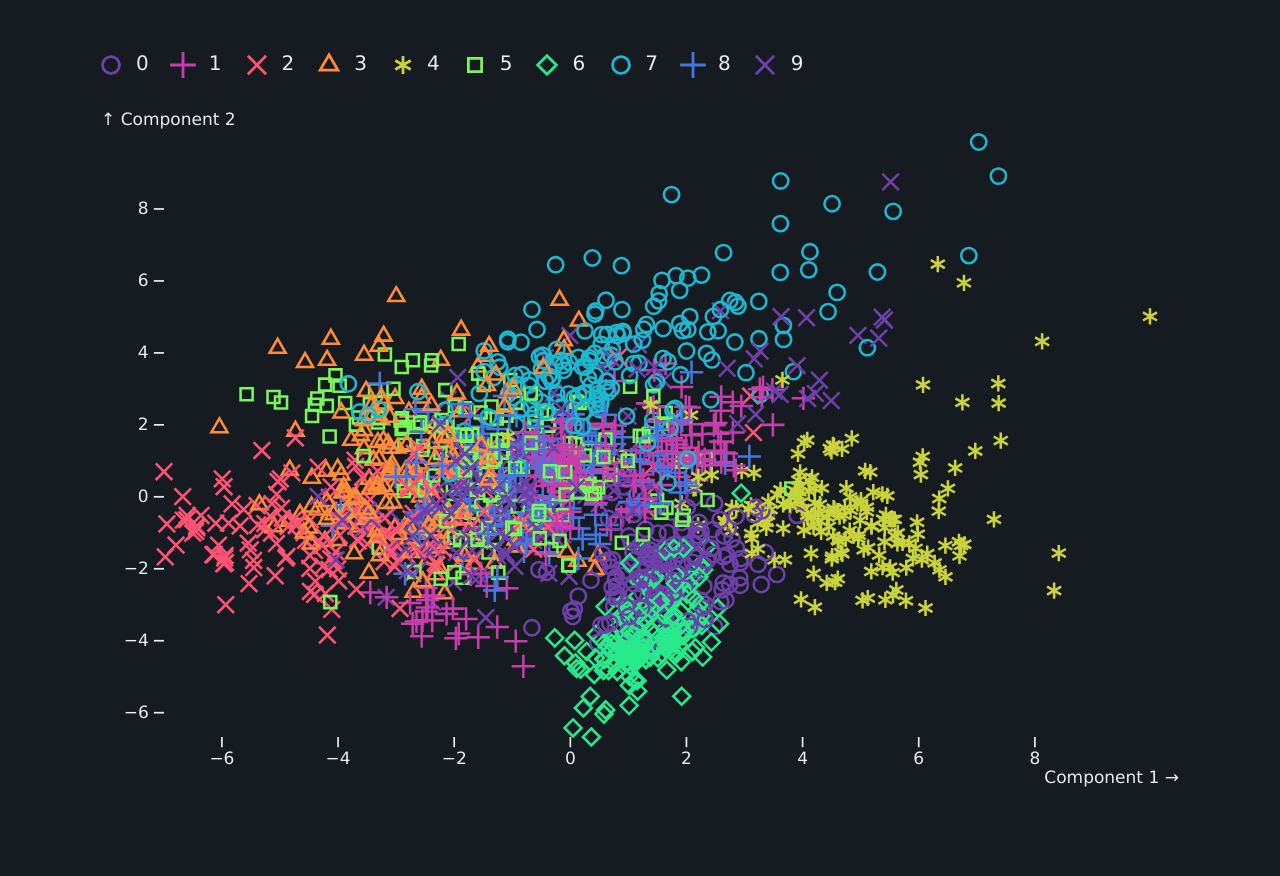
plot = Plot.plot({
"style": {"backgroundColor": "#161b22", "color": "#e6edf3"},
"symbol": {"legend": js("true")},
"color": {"scheme": "rainbow"},
"marks": [
Plot.dot(js("data"), {
"x": "Component 1",
"y": "Component 2",
"stroke": "digit",
"symbol": "digit"
})
]
})
render(df, plot, style={"body": {"background": "#161b22", "color": "#e6edf3"}})