


grafanimate
Animate timeseries data with Grafana.
About
grafanimate captures screenshots while animating a Grafana dashboard by
manipulating its time range control, i.e. navigating through time. The
result can be rendered as a sequence of png images, an animated gif file,
and as a video file.
Attention!
This program can put significant load on your Grafana instance and the underlying database machinery. Handle with care!
Setup
Prerequisites
This program uses the fine FFmpeg program for doing the heavy lifting within in its postprocessing subsystem.
grafanimate
pip install grafanimate
Note
We absolutely recommend installing this program into a Python virtualenv:
python3 -m venv .venv
source .venv/bin/activate
pip install grafanimate
Usage
Introduction
grafanimate works by operating on animations defined within description
files, written in Python. In cinematography jargon, this is called "exposure
sheet", or "dope sheet".
An exposure sheet (also known variously as "dope sheet", "camera instruction sheet", or "X-sheet") is a sheet of paper used primarily in traditional animation to mark out the timing of various actions and dialogue.
grafanimate offers convenient data types, AnimationScenario and
AnimationSequence, for outlining an animation scenario made of multiple
sequences.
Please have a look at the scenarios.py file for a full example containing multiple scenarios.
Synopsis
A scenario definition:
AnimationScenario(
    grafana_url="https://play.grafana.org/",
    dashboard_uid="000000012",
    sequences=[
        AnimationSequence(
            start="2021-11-15T02:12:05Z",
            stop="2021-11-15T02:37:36Z",
            every="5min",
            mode=SequencingMode.CUMULATIVE,
        ),
    ],
)
In order to run a built-in scenario, invoke:
grafanimate --scenario=playdemo --output=./animations
Details
grafanimate also supports relative timestamps, based on the fine
pytimeparse2 library.
- Within
every, you will express a duration.
Help
For getting a detailed and descriptive overview about all available command line options, please invoke:
grafanimate --help
Examples
Examples for scenario mode. Script your animations in file scenarios.py or
any other Python module or file.
# Use freely accessible `play.grafana.org` for demo purposes.
grafanimate --scenario=playdemo --output=./animations

# Example for generating Luftdaten.info graph & map.
export GRAFANIMATE_OUTPUT=./animations
grafanimate --grafana-url=http://localhost:3000/ --dashboard-uid=1aOmc1sik --scenario=ldi_all

# Use more parameters to control the rendering process.
grafanimate --grafana-url=http://localhost:3000/ --dashboard-uid=acUXbj_mz --scenario=ir_sensor_svg_pixmap \
    --header-layout=studio --datetime-format=human-time --panel-id=6
Gallery
Composition: The Hiveeyes Project. Developing a flexible beehive monitoring infrastructure. Clicking on an image will take you to the animated version.
luftdaten.info coverage
Coverage of luftdaten.info sensors starting October 2015 across Europe.
- Data source: luftdaten.info (LDI)
- Production: Luftdatenpumpe, LDI data plane v2, daily.
- Development: Erneuerung der Luftdatenpumpe. All contributions welcome.
Fine dust pollution on New Year's Eve
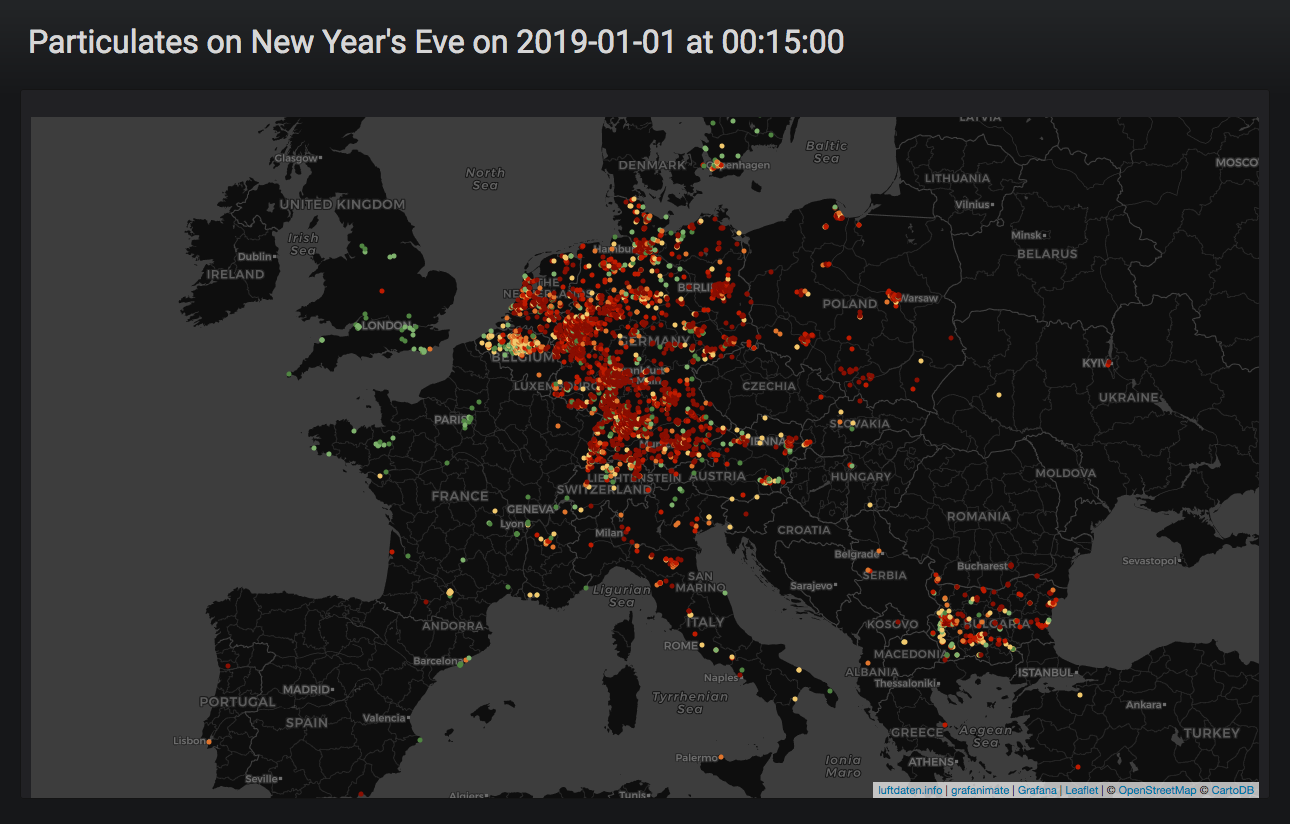
- Data source: luftdaten.info (LDI)
- Production: Luftdatenpumpe, LDI data plane v2, historical.
- Development: Erneuerung der Luftdatenpumpe. All contributions welcome.
DWD CDC
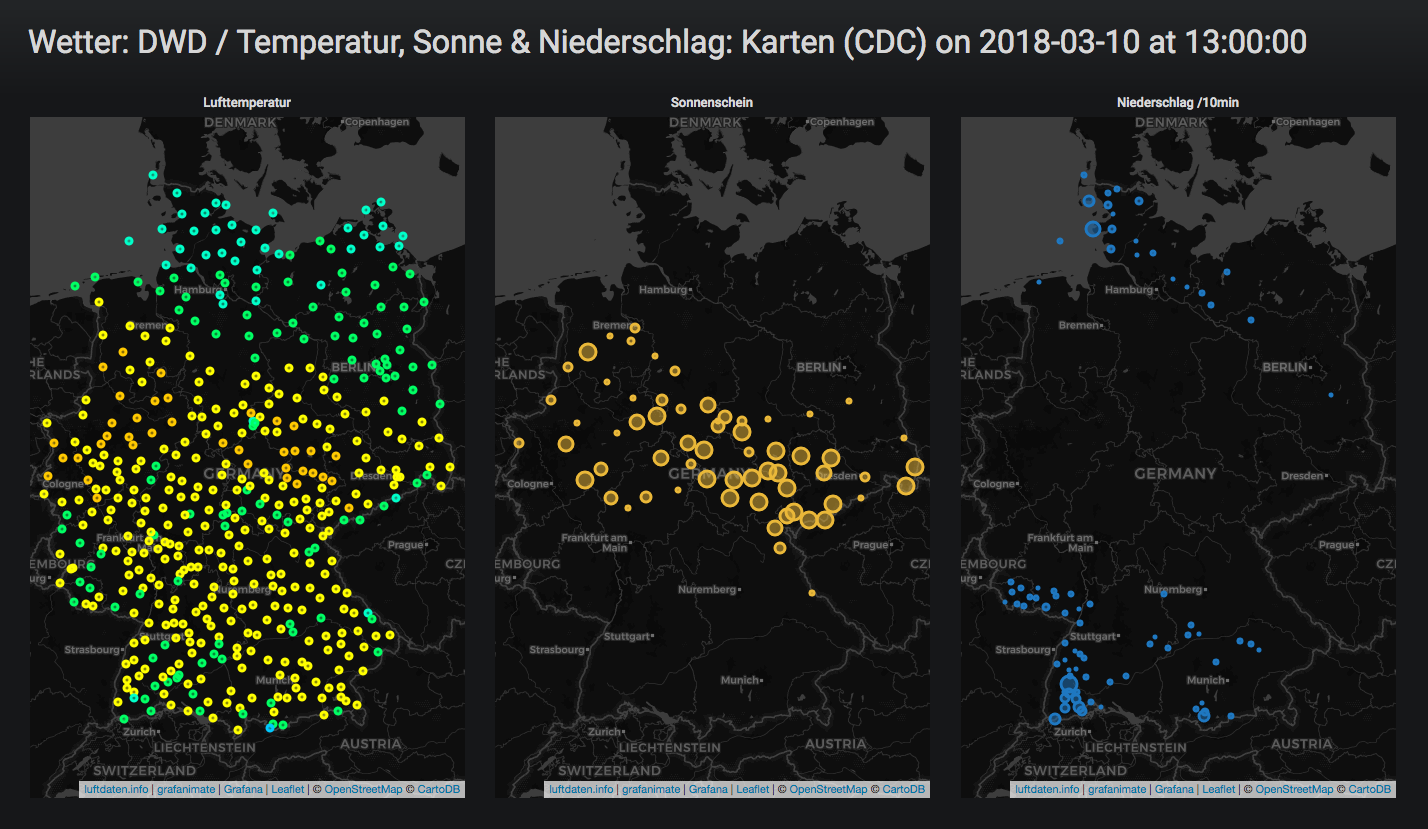
- Data source: DWD Open Data (DWD)
- Production: DWD Climate Data Center (CDC), 10m-Werte: Aktuelle Lufttemperaturen, Sonnenscheindauer & Niederschlag
- Development: <work in progress>
IR-Sensor SVG-Pixmap
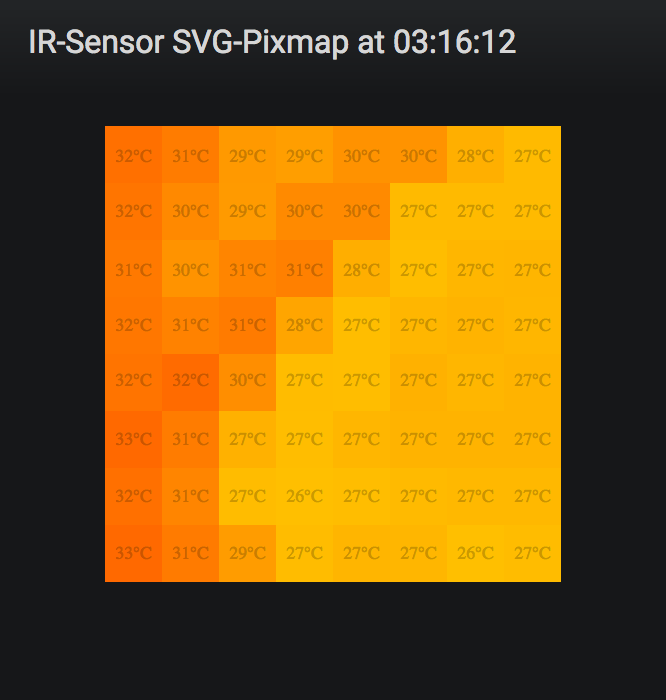
IR-Sensor SVG-Pixmap displaying temperature changes inside a beehive.
- Data source: Clemens Gruber (CG)
- Development: How to Visualize 2-Dimensional Temperature Data in Grafana
Background and details
Introduction
Animating things in Grafana across the time-axis in the spirit of the GeoLoop Panel Plugin hasn't been unlocked for Grafana in a more general way yet. Challenge accepted!
Time warp
At this programs' core is the code to set time range in Grafana:
timeSrv = angular.element('grafana-app').injector().get('timeSrv');
timeSrv.setTime({from: "2015-10-01", to: "2018-12-31"});
Rendering engine
Turtles all the way up, the main rendering work horse is a Firefox Browser automated through Marionette Python Client fame:
The Marionette Python client library allows you to remotely control a Gecko-based browser or device which is running a Marionette server.
Outlook
Neither Playlists nor Scripted Dashboards (now deprecated) offer these things to the user, but this program can be combined with both in order to implement more complex animations on top of Grafana.
Development
# Acquire sources.
git clone https://github.com/panodata/grafanimate
cd grafanimate

# Create and activate virtualenv.
python3 -m venv .venv
source .venv/bin/activate

# Install package in "editable" mode.
pip install --editable=.

# Run tests.
make test
Project information
The code lives on GitHub and the Python package is published to PyPI.
Contributing
We are always happy to receive code contributions, ideas, suggestions and problem reports from the community. Spend some time taking a look around, locate a bug, design issue or spelling mistake and then send us a pull request or create an issue. You can also discuss grafanimate on our forum, you are welcome to join.
Acknowledgements
Thanks to all the contributors who helped to co-create and conceive this program in one way or another. You know who you are.
Also thanks to all the people working on Python, Grafana, Firefox, FFmpeg, and the countless other software components this program is based upon.
License
grafanimate is licensed under the terms of the GNU AGPL v3 license.

