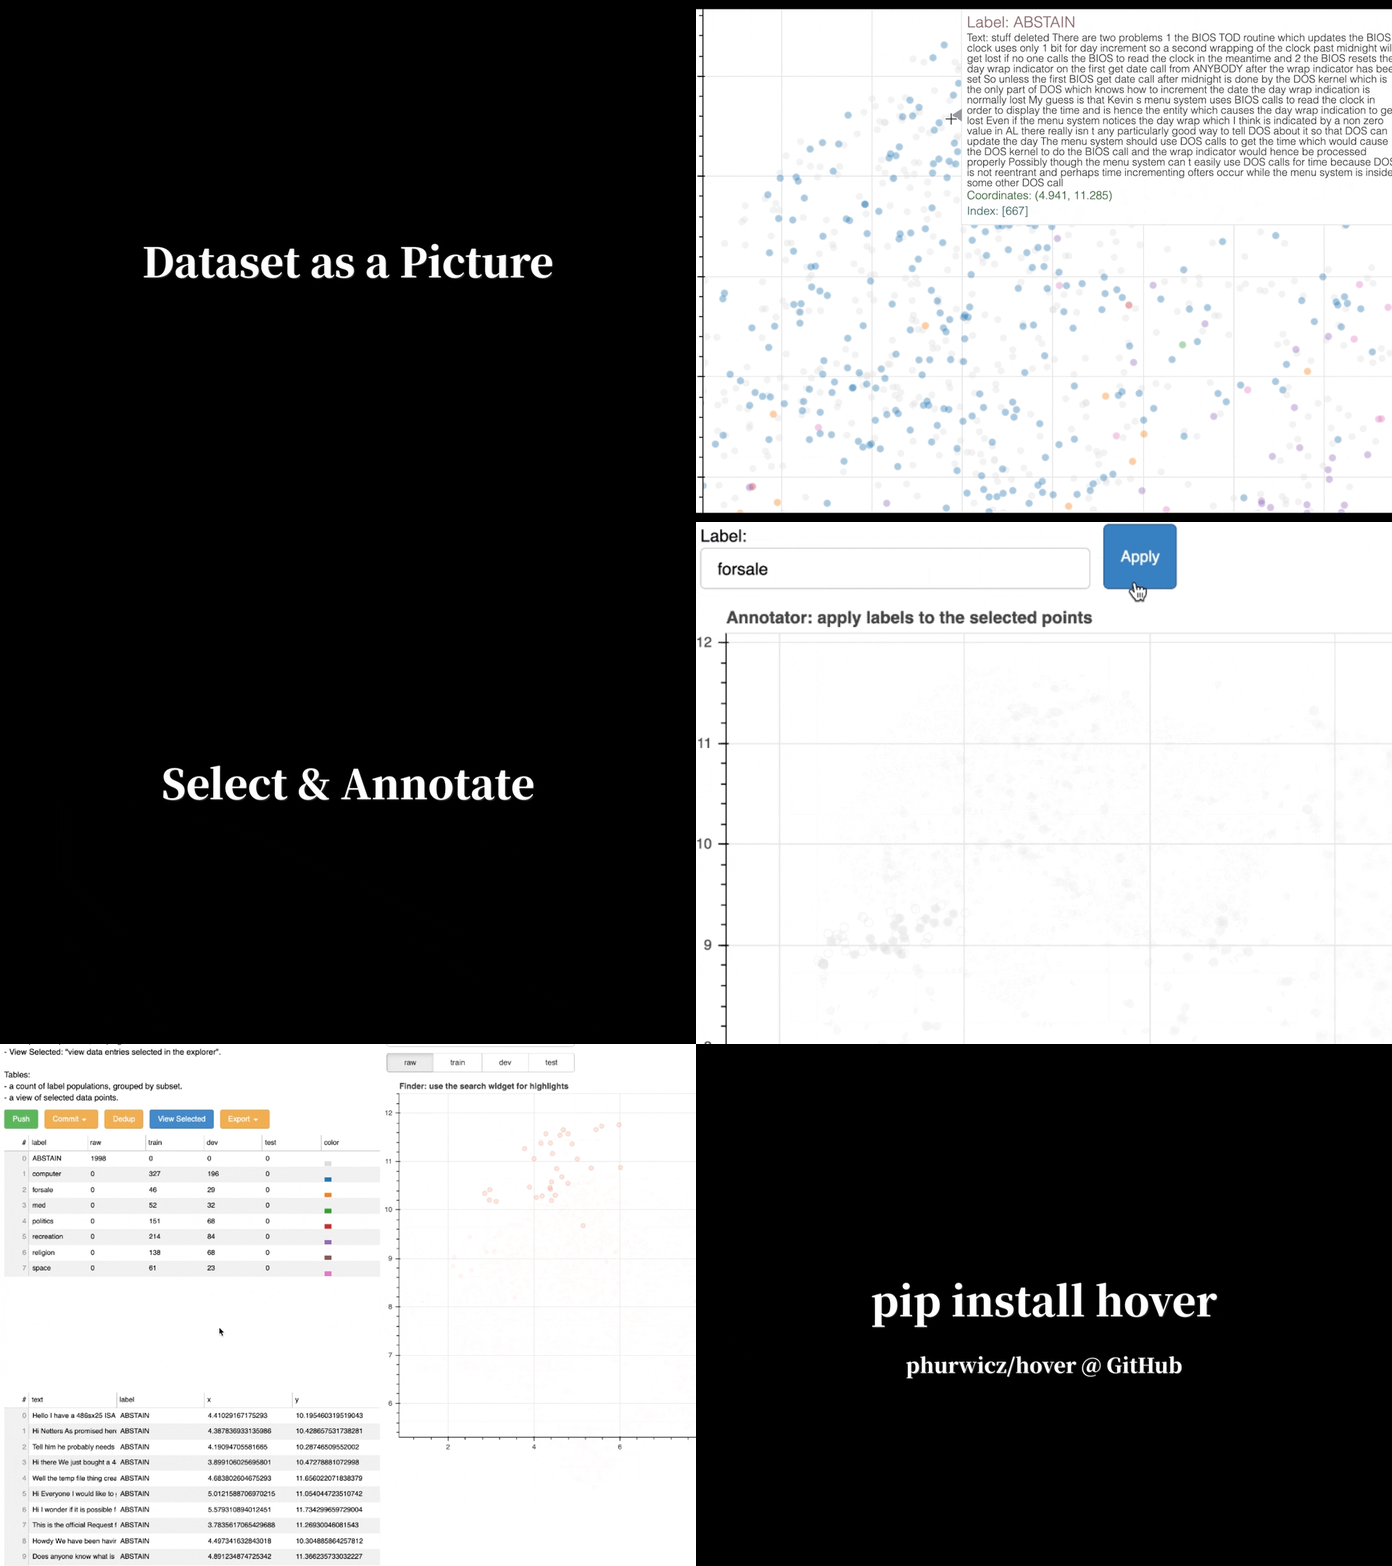
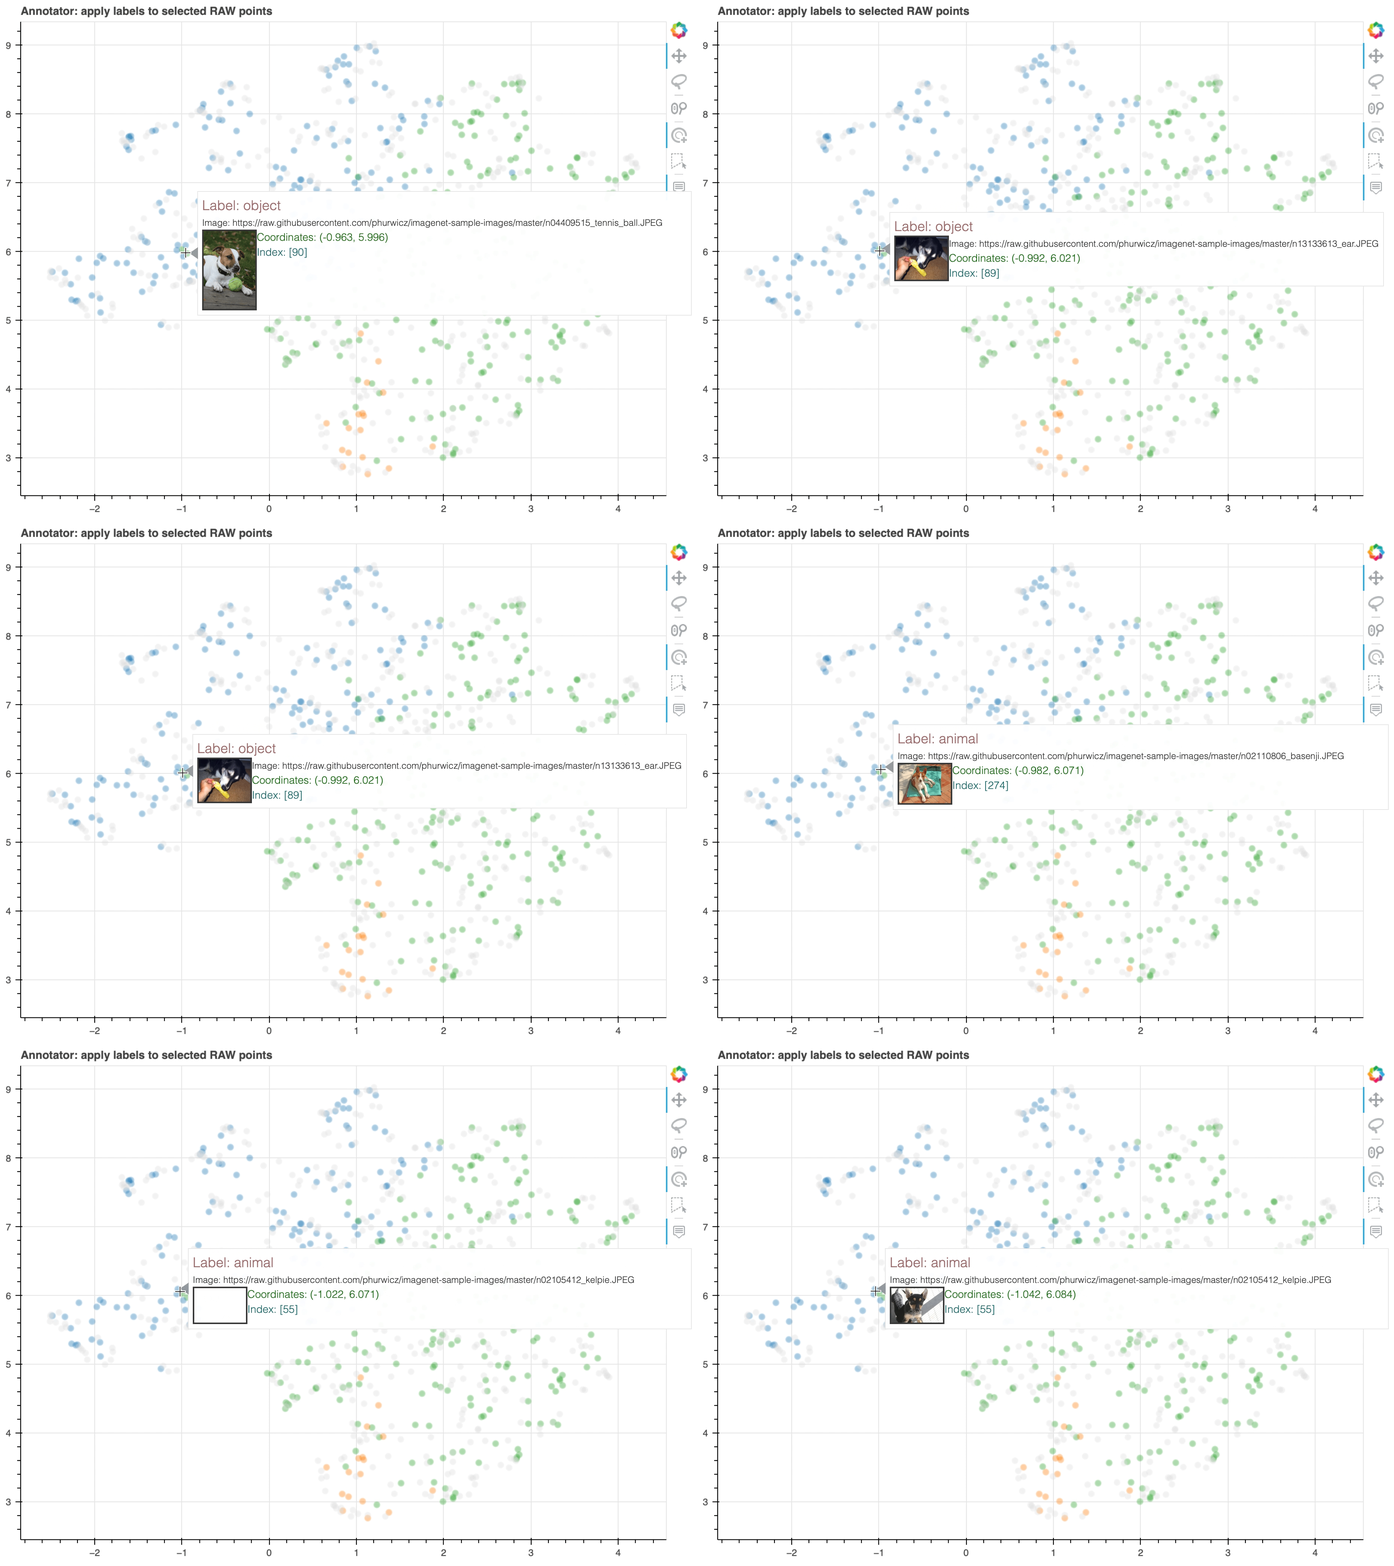
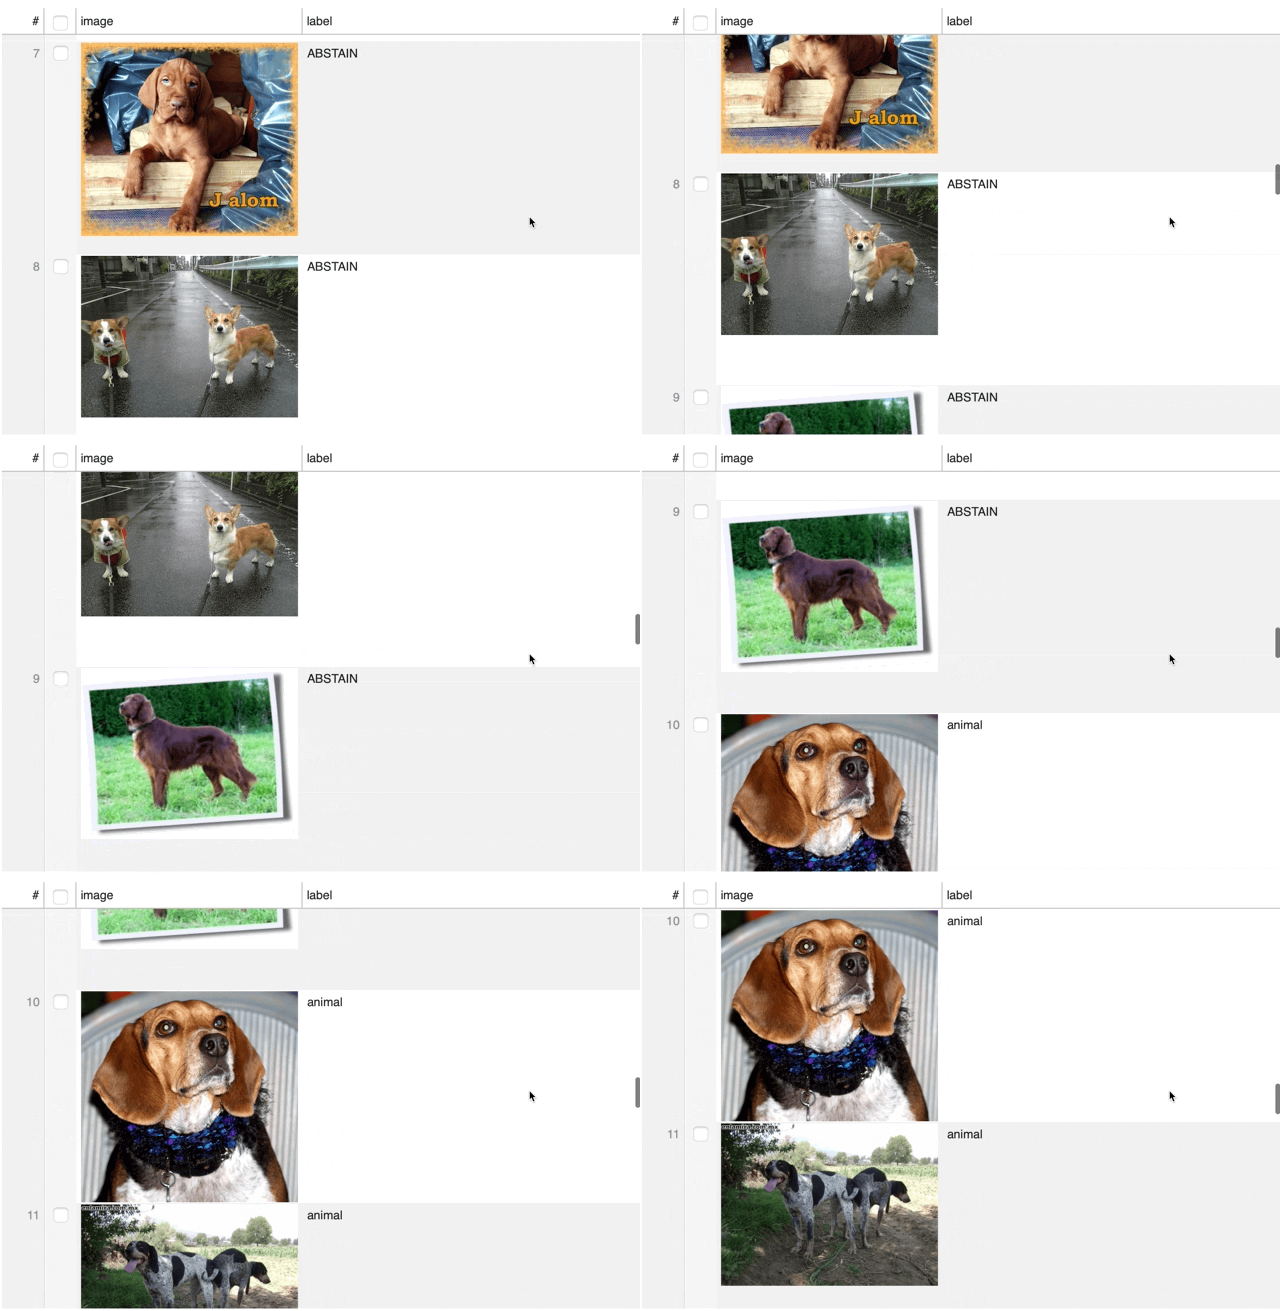
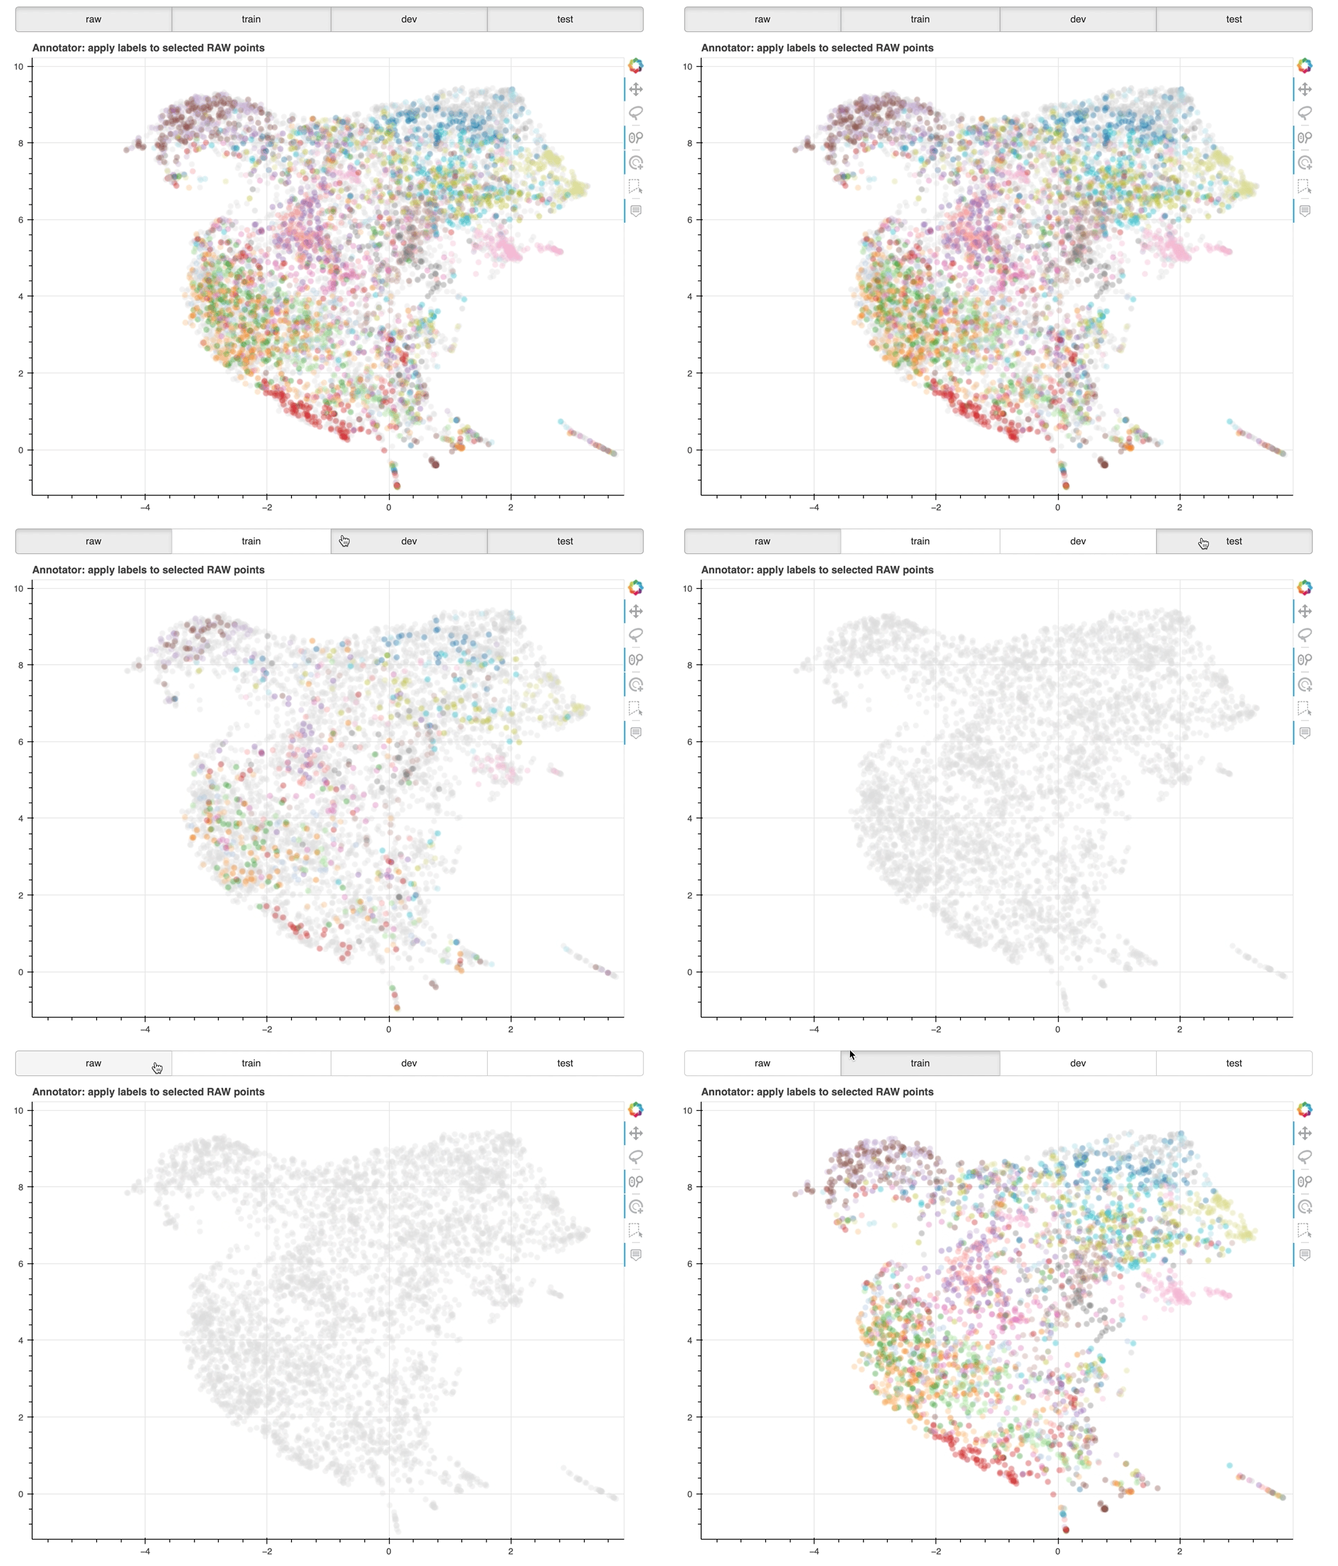
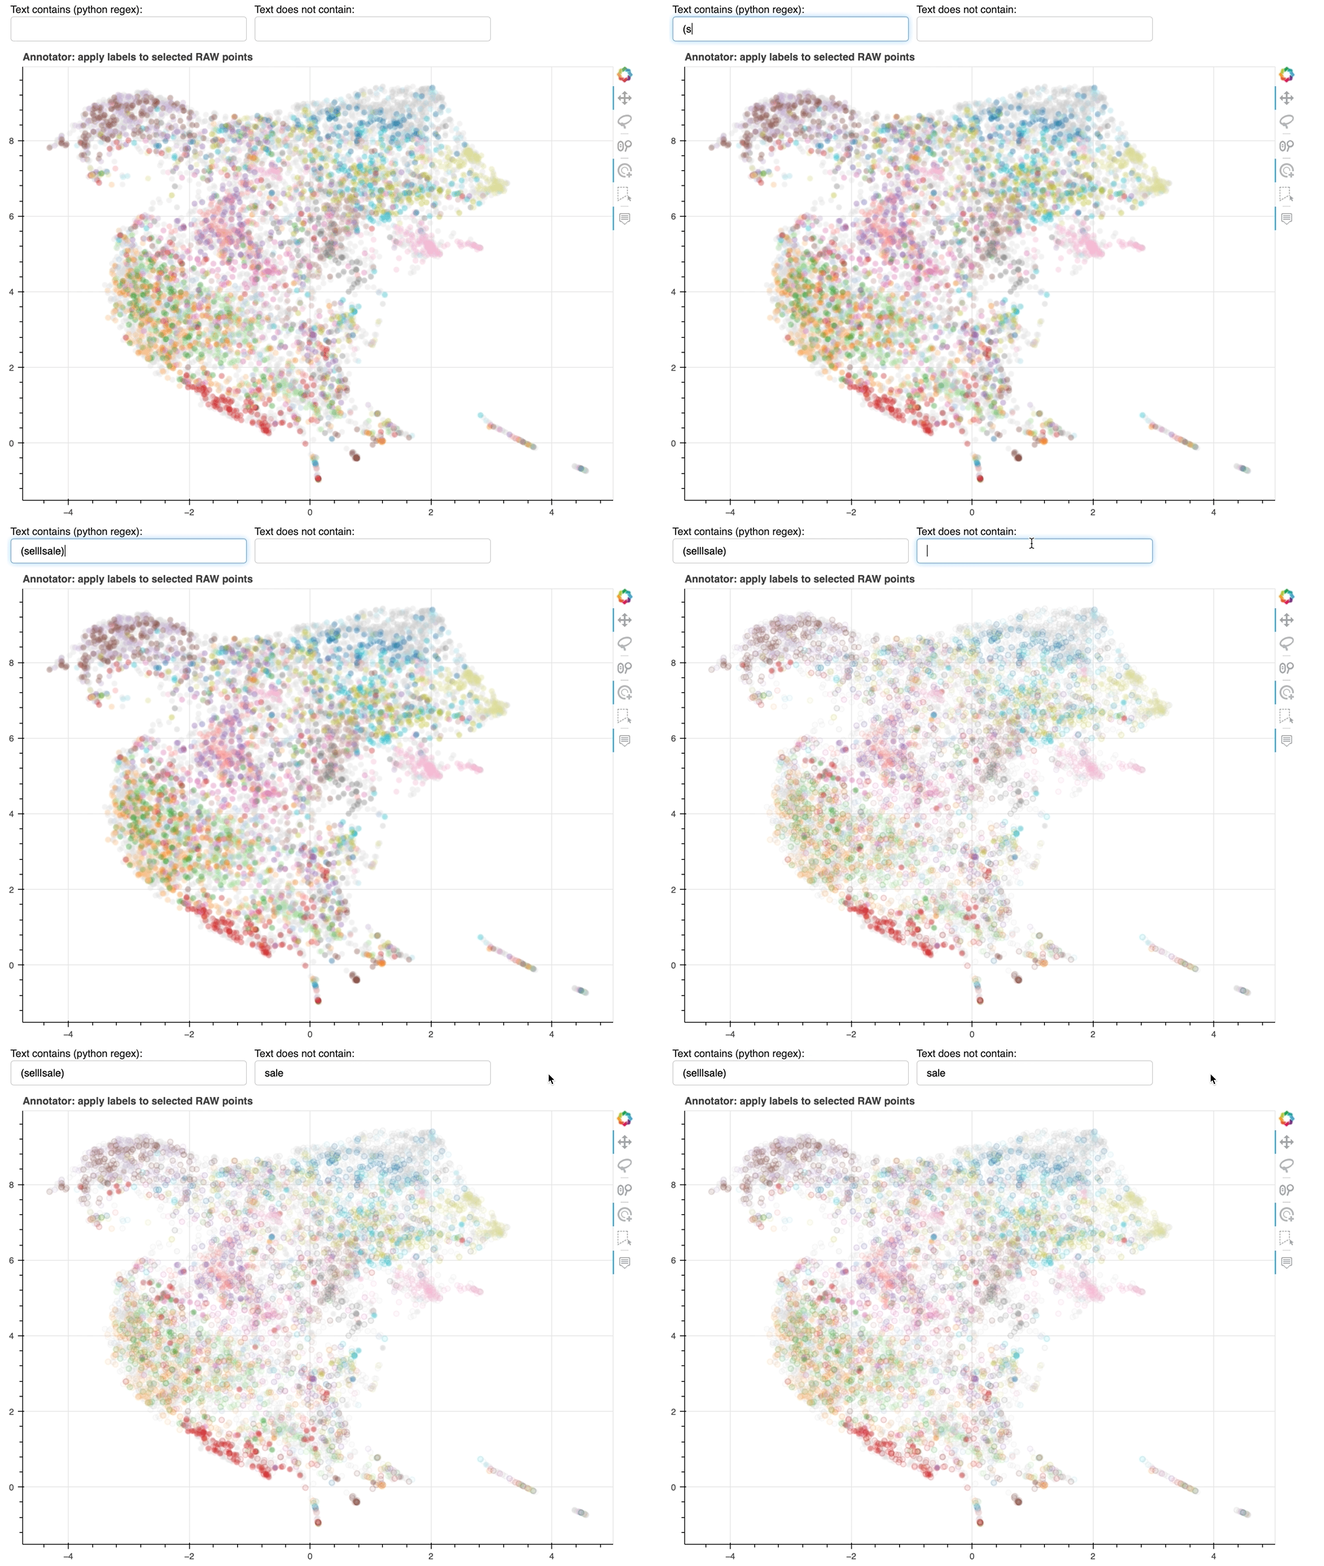
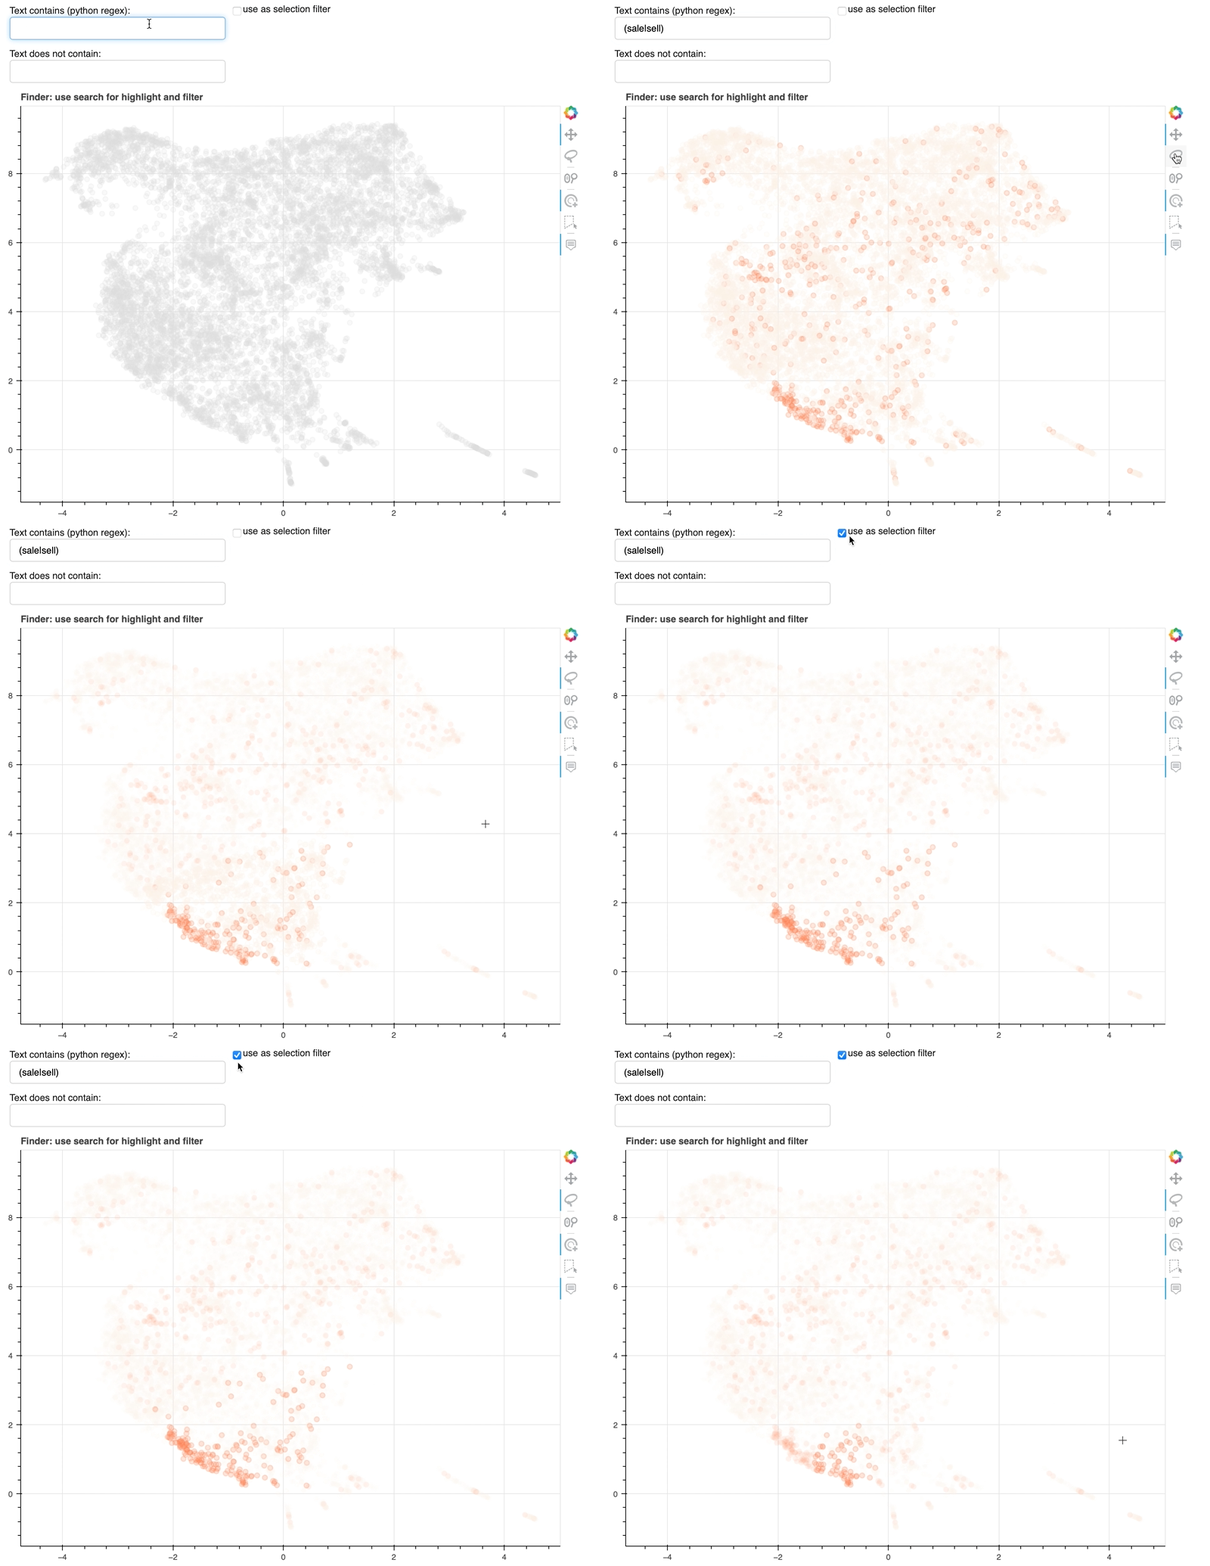
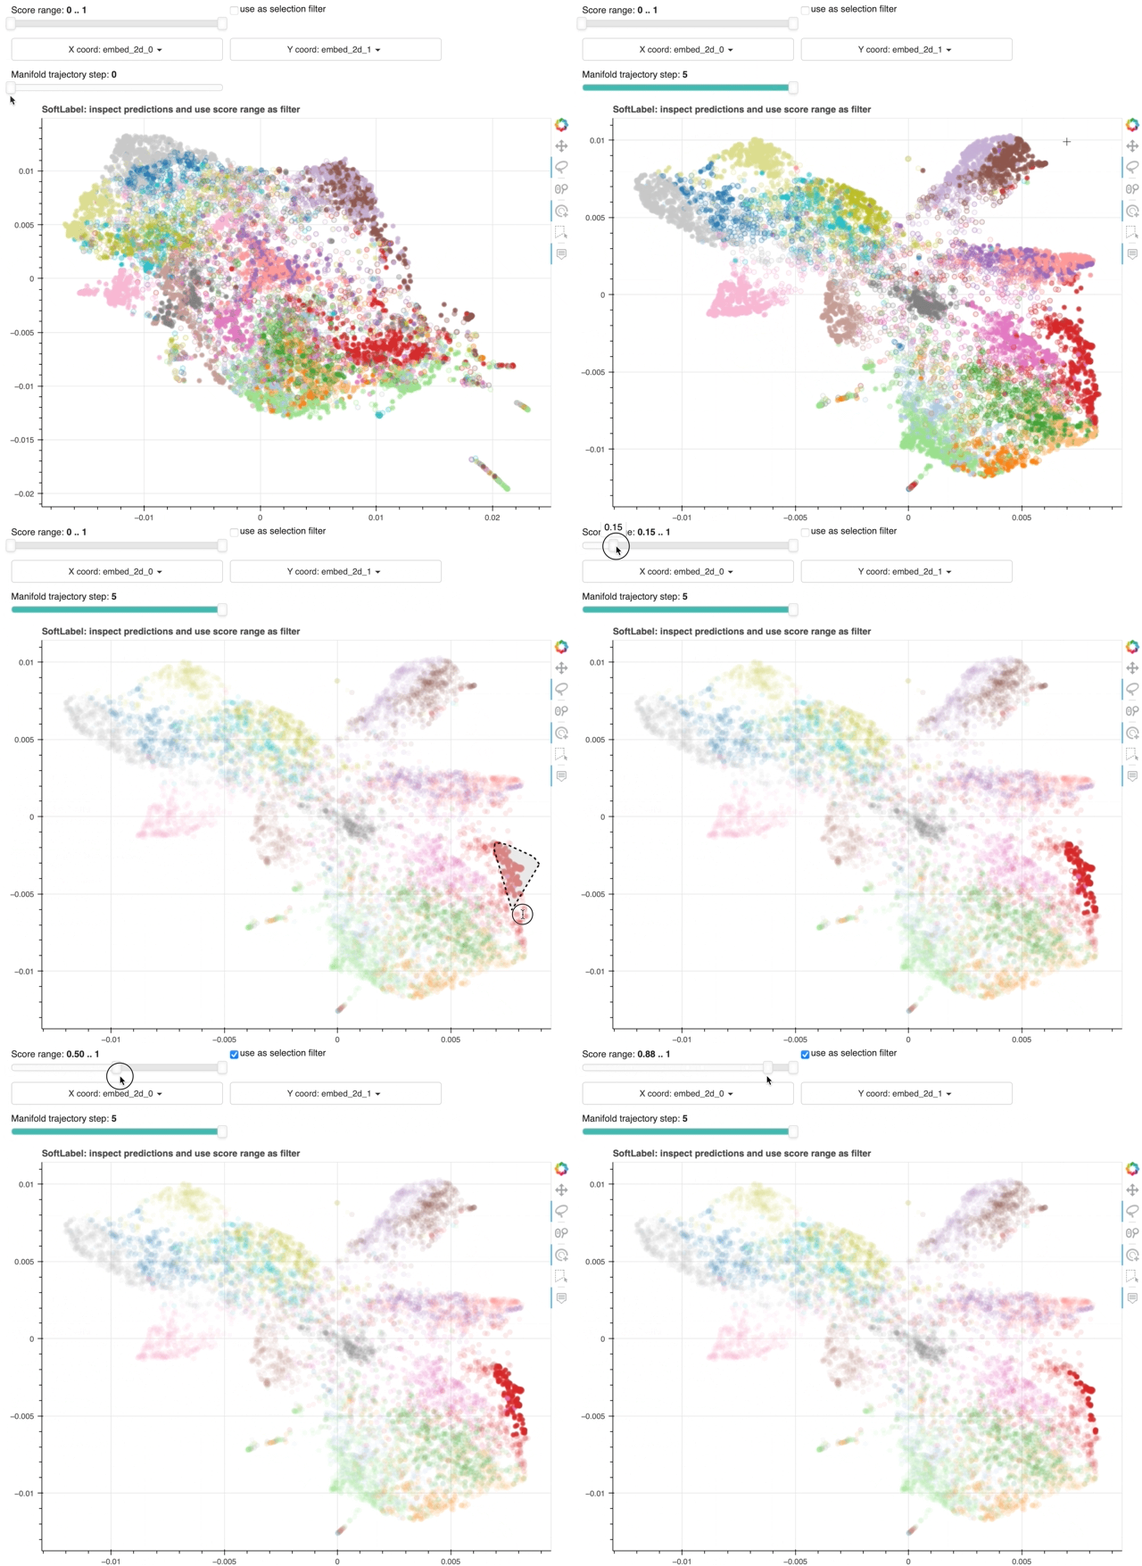
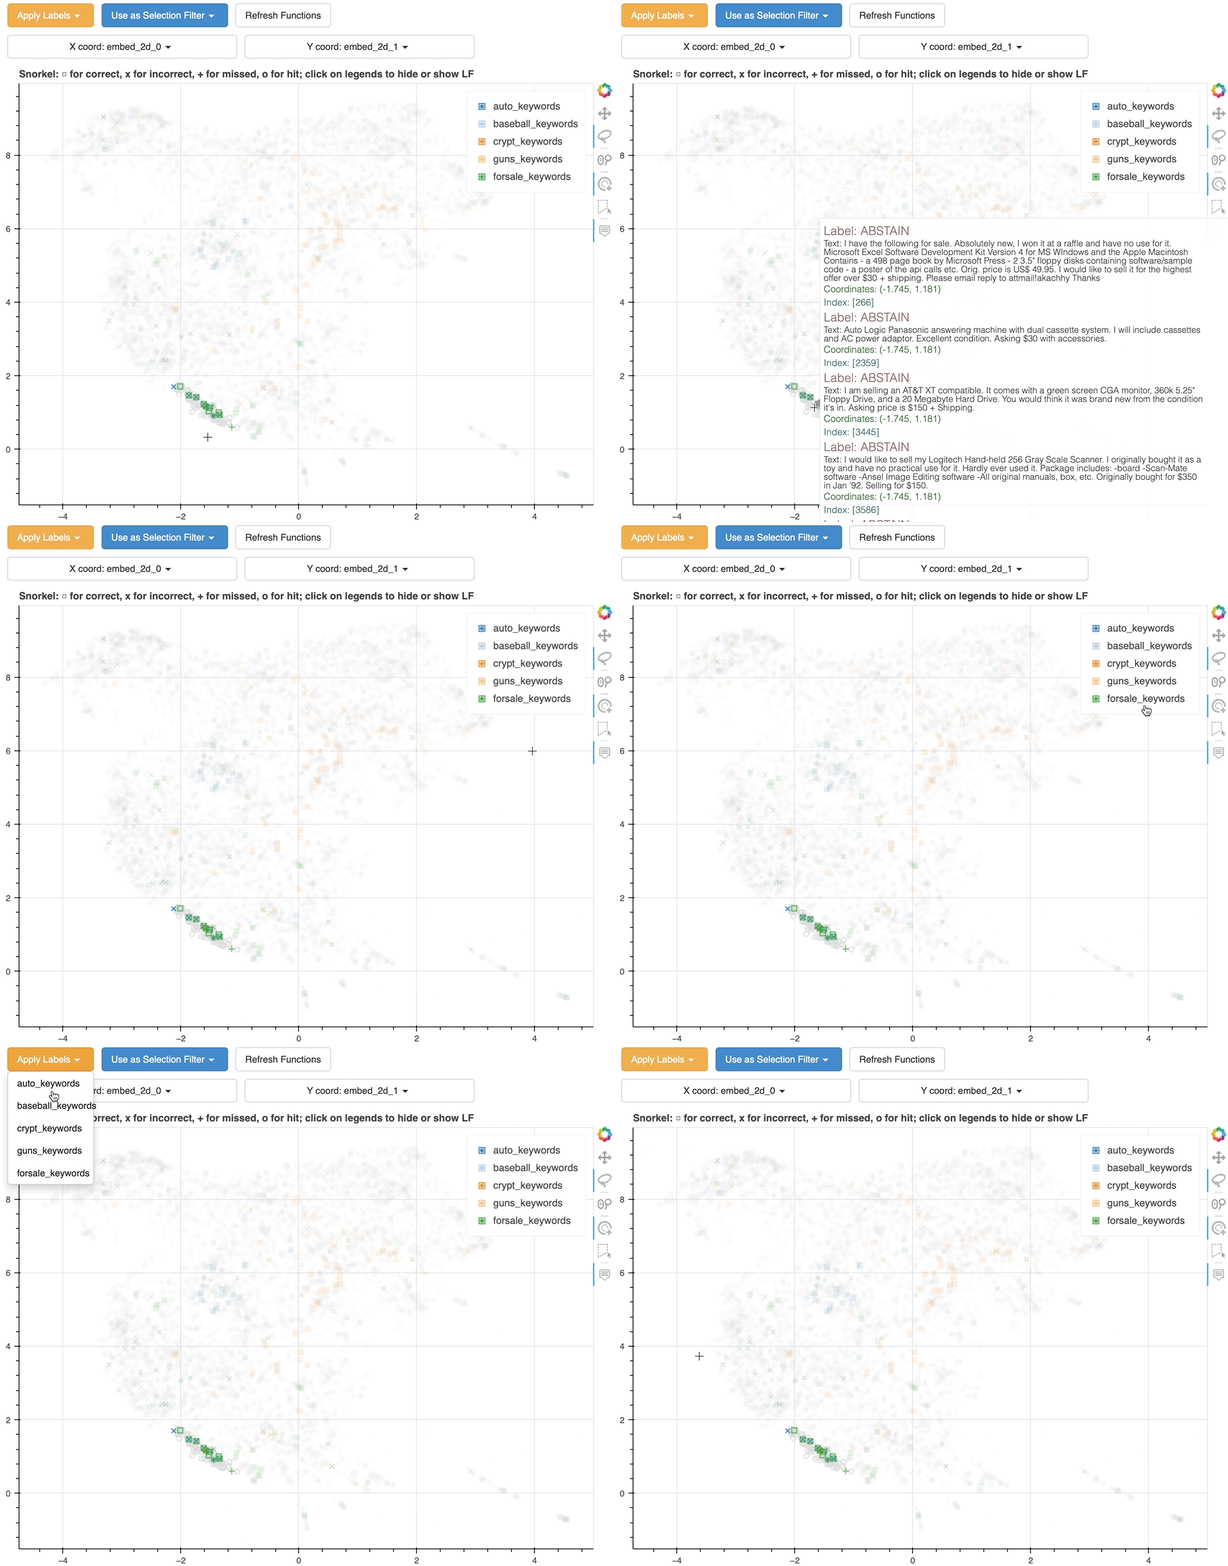
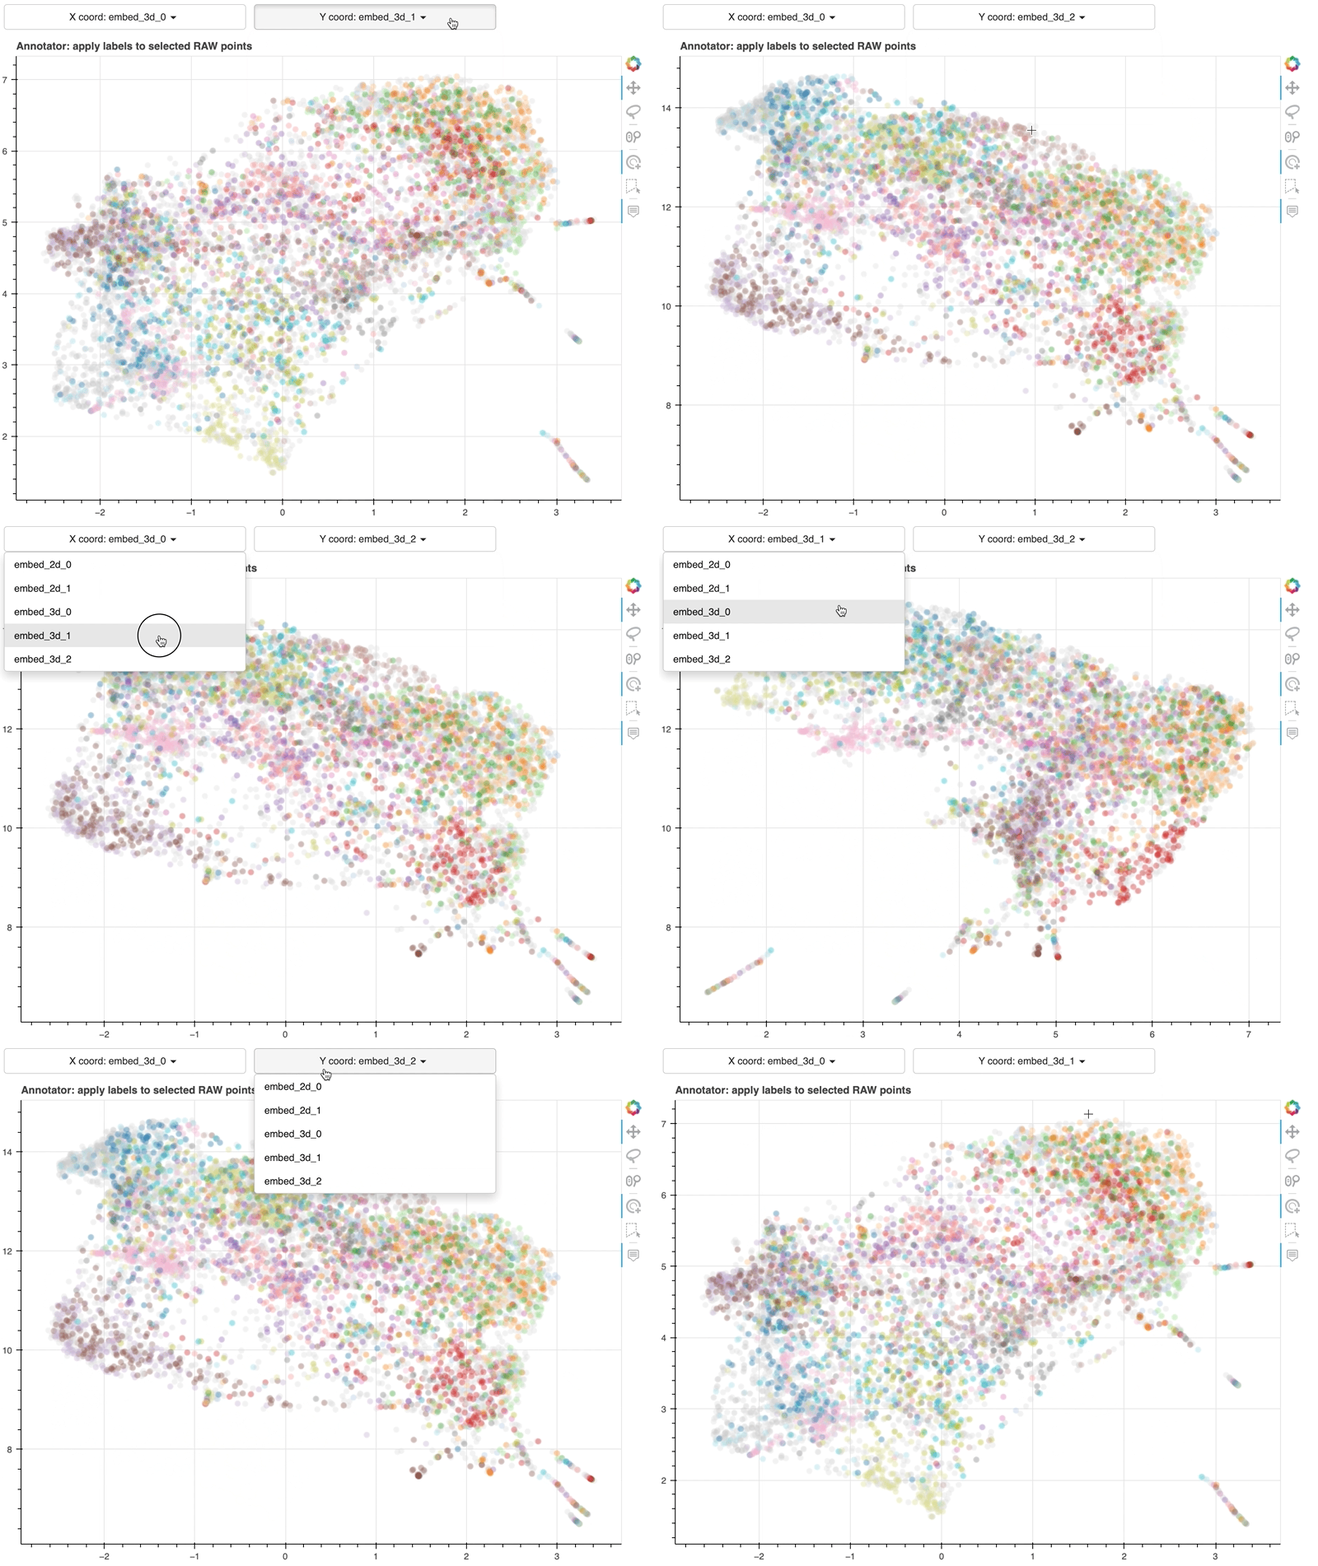
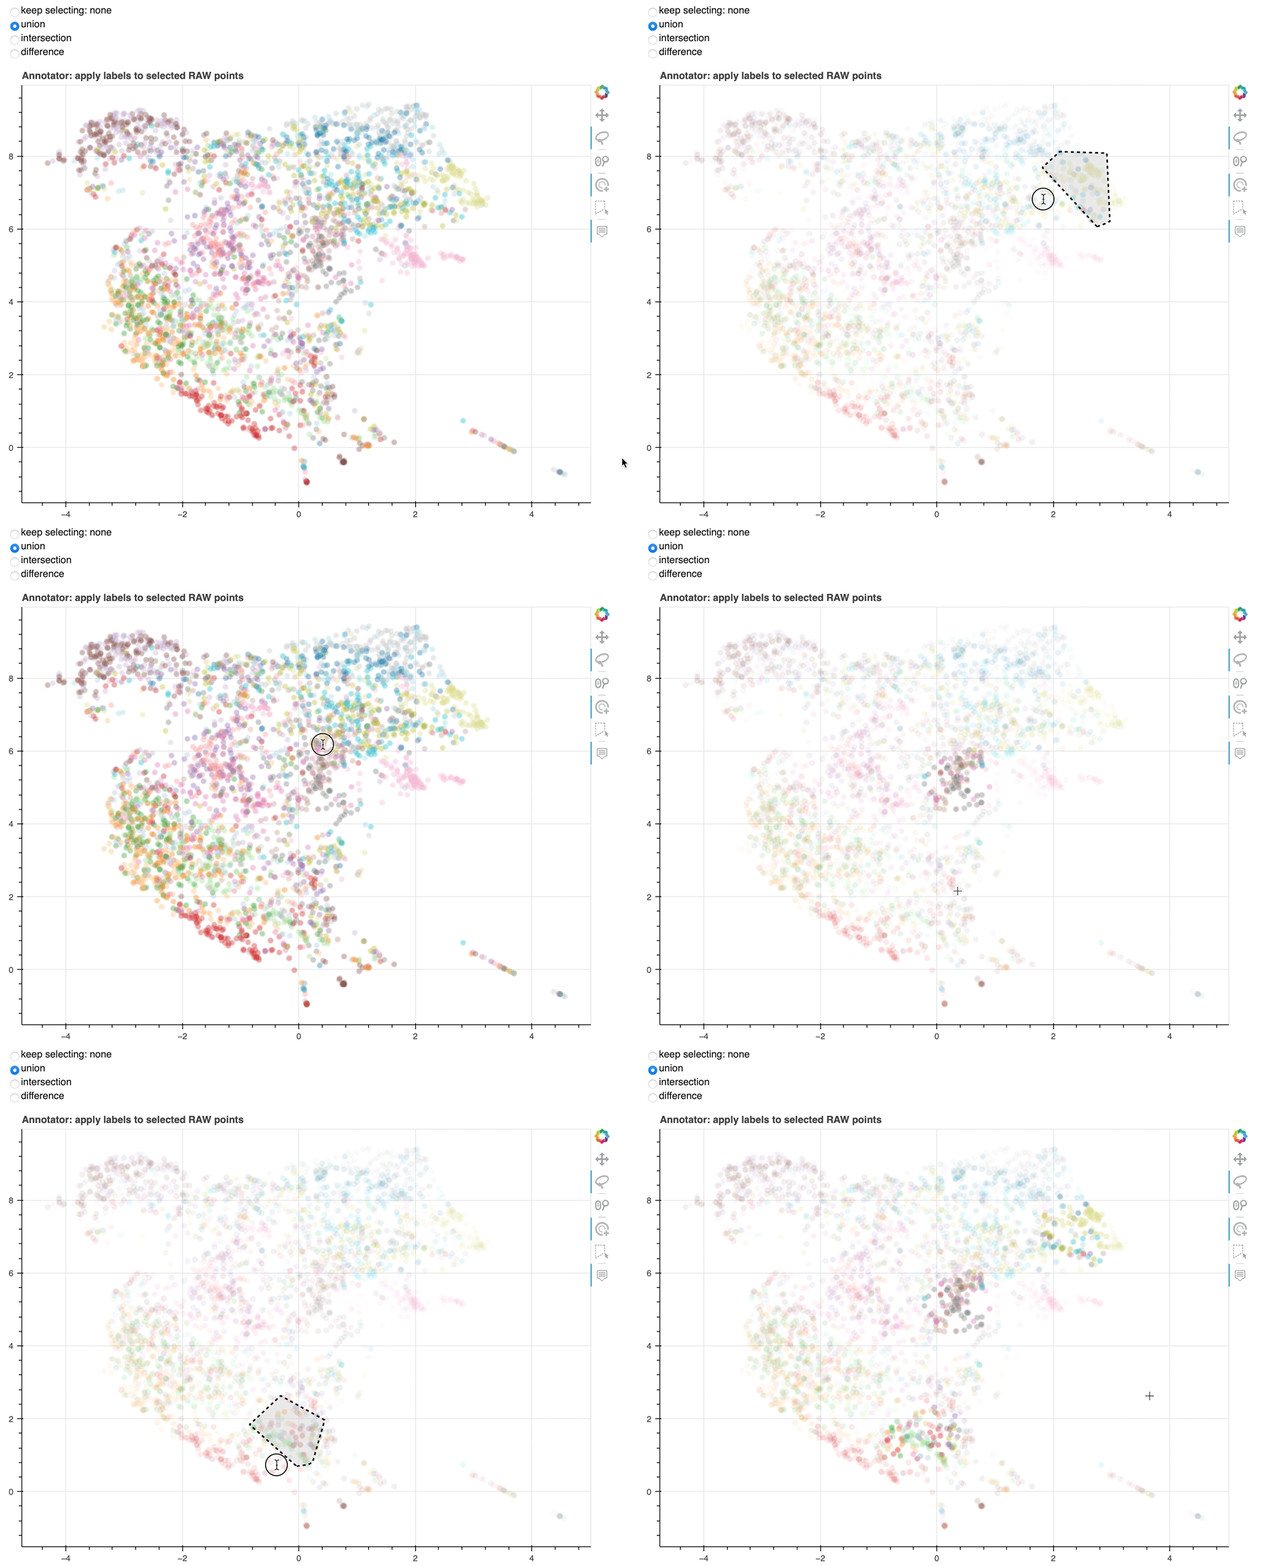
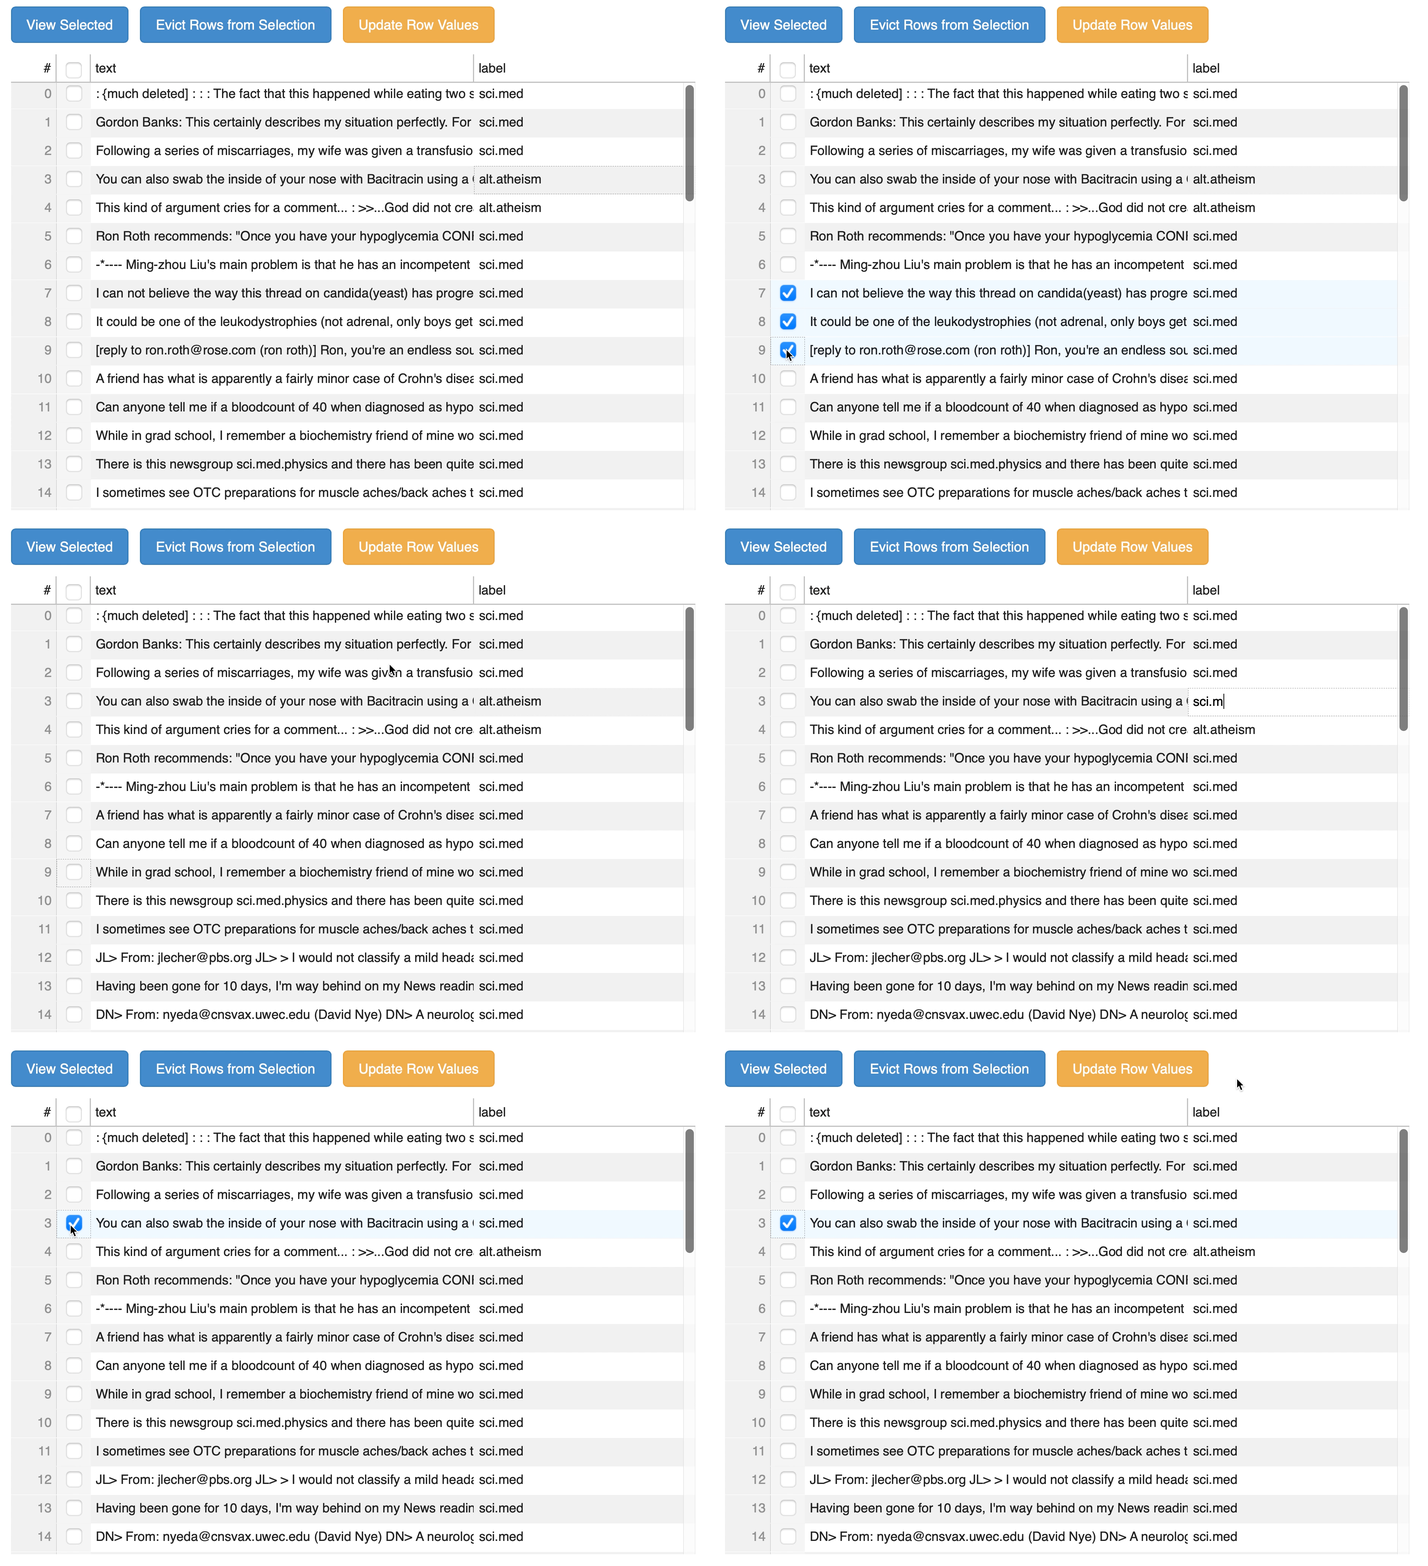
Explore and label on a map of raw data.
Get enough to feed your model in no time.
hover speeds up data labeling through embedding + visualization + callbacks.
- You just need raw data and an embedding to get a map.
- Explore the map to find "zones" that are easy and those that are tricky.
- Start the conquest of your data by coloring the zones through wisdom!
🚀 Live Demos
With code
- edit & run code in your browser to get a labeling interface, with guides along the way.
Without code
- go directly to a labeling interface, pre-coded and hosted on Binder.
✨ Features (click bullets to show GIF)
It's fast because it labels data in bulk.
It's accurate because multiple angles work together.
It's flexible (and fun!) because the process never gets old.
📦 Install
Python: 3.8+
OS: Linux & Mac & Windows
PyPI (for all releases): pip install hover
Conda-forge (for 0.6.0 and above): conda install -c conda-forge hover
For Windows users, we recommend Windows Subsystem for Linux.
- On Windows itself you will need C++ build tools for dependencies.
📖 Resources
🎏 Announcements
-
Jan 21, 2023 version 0.8.0 is now available. Check out the changelog for details
🥳 .
🔔 Remarks
Shoutouts
- Thanks to
Bokehbecausehoverwould not exist without linked plots and callbacks, or be nearly as good without embeddable server apps. - Thanks to Philip Vollet for sharing
hoverwith the community even when it was really green.
Contributing
- All feedbacks are welcome, especially what you find lacking and want it fixed!
-
./requirements-dev.txtlists required packages for development. - Pull requests are advised to use a superset of the pre-commit hooks listed in .pre-commit-config.yaml.
Citation
If you have found hover useful to your work, please let us know
@misc{hover,
  title={{hover}: label data at scale},
  url={https://github.com/phurwicz/hover},
  note={Open software from https://github.com/phurwicz/hover},
  author={
    Pavel Hurwicz and
    Haochuan Wei},
  year={2021},
}


