hubify
Create GitHub-like visualisations from your time series data.
Basic Usage
# A list of datetimes, where each datetime represents an observation
from datetime import datetime, timedelta
import random
# Import Hubify
from hubify import hubify
# Set a seed
random.seed(42)
# Create 400 random events
events = [
datetime.today() - timedelta(days=random.randint(0, 365))
for _ in range(400)
]
# Call hubify
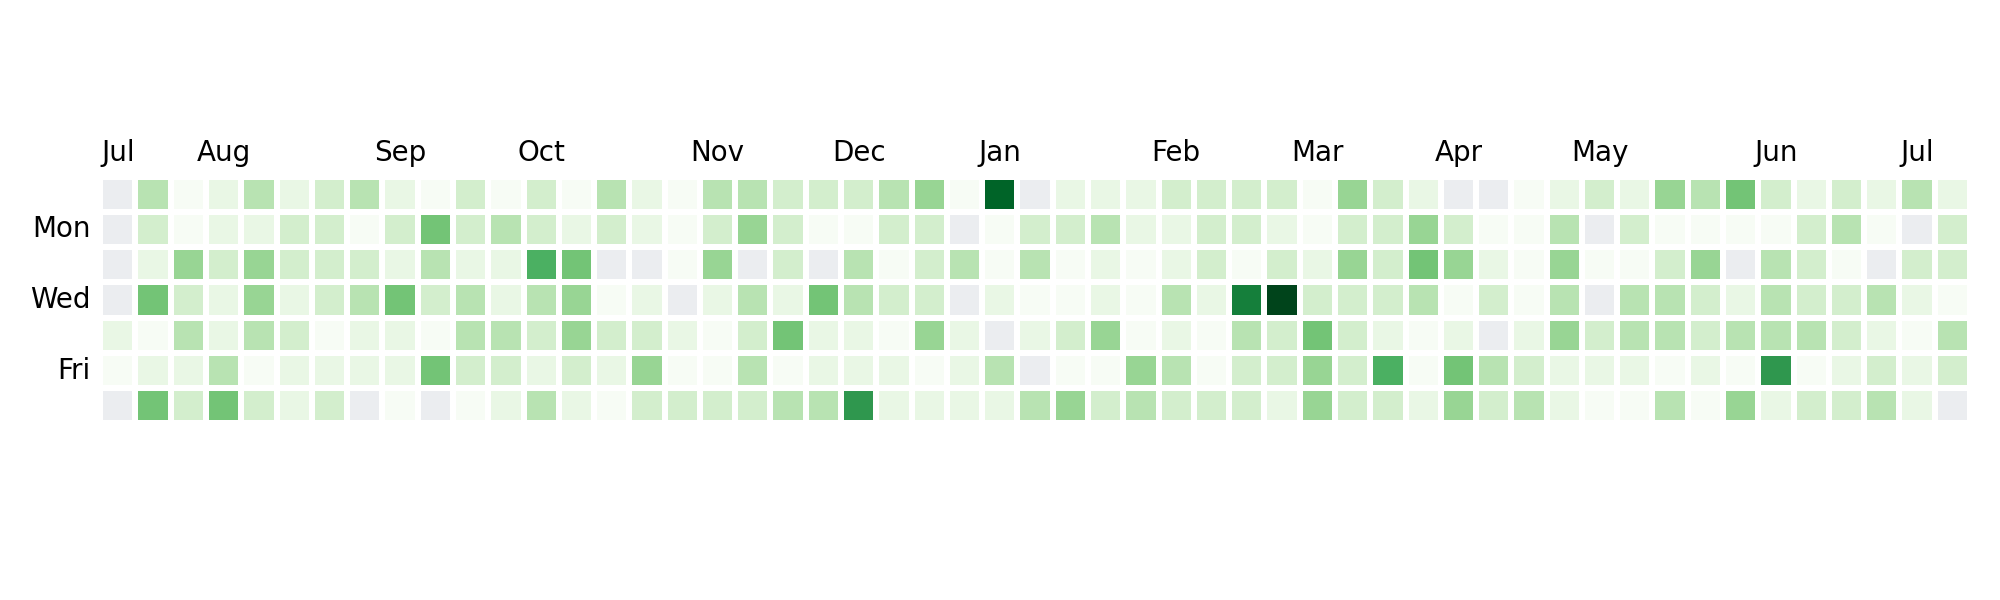
hubify(events)You should see something like this
Installation
pip install hubify