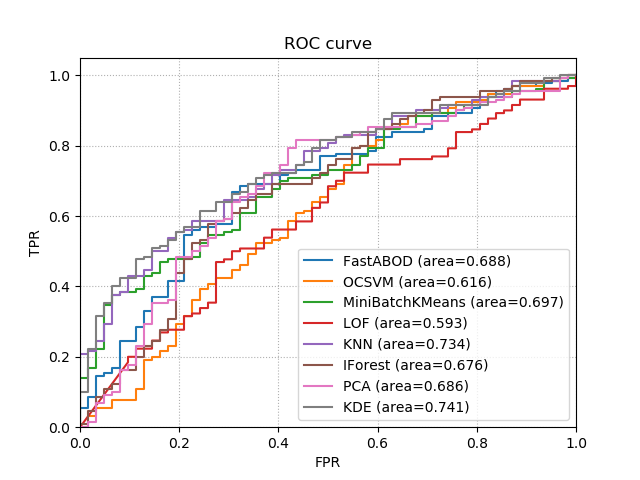
import matplotlib.pyplot as plt
import numpy as np
from kenchi.datasets import load_pima
from kenchi.outlier_detection import*from kenchi.pipeline import make_pipeline
from sklearn.model_selection import train_test_split
from sklearn.preprocessing import StandardScaler
np.random.seed(0)
scaler = StandardScaler()
detectors = [
FastABOD(novelty=True, n_jobs=-1), OCSVM(),
MiniBatchKMeans(), LOF(novelty=True, n_jobs=-1),
KNN(novelty=True, n_jobs=-1), IForest(n_jobs=-1),
PCA(), KDE()
]
# Load the Pima Indians diabetes dataset.
X, y = load_pima(return_X_y=True)
X_train, X_test, _, y_test = train_test_split(X, y)
# Get the current Axes instance
ax = plt.gca()
for det in detectors:
# Fit the model according to the given training data
pipeline = make_pipeline(scaler, det).fit(X_train)
# Plot the Receiver Operating Characteristic (ROC) curve
pipeline.plot_roc_curve(X_test, y_test, ax=ax)
# Display the figure
plt.show()
Goldstein, M., and Dengel, A.,
"Histogram-based outlier score (HBOS): A fast unsupervised anomaly detection algorithm,"
KI: Poster and Demo Track, pp. 59-63, 2012.
The Tidelift Subscription provides access to a continuously curated stream of human-researched and maintainer-verified data on open source packages and their licenses, releases, vulnerabilities, and development practices.