

![]()
User-friendly locking of lasers using RedPitaya (STEMlab 125-14) that just works. Linien aims to follow the UNIX philosophy of doing a single thing (locking using intelligent algorithms) very well. It was mainly developed for locking spectroscopy signals but may also be used for Pound-Drever-Hall or other lock-in techniques as well as simple PID operation. Linien is built with Python and Migen and is based on red pid.
- All included: Sinusoidal modulation (up to 50 MHz), demodulation (1f to 5f), filtering and servo implemented on the FPGA.
- Client-server architecture: Autonomous operation on RedPitaya. One or multiple GUI clients or python clients can connect to the server.
- Autolock: Click and drag over a line, and Linien will automatically lock to it. This algorithm is built to be noise and jitter tolerant.
- IQ demodulation: Optimize demodulation phase in an instant
- Noise analysis: Record power spectral density (PSD) of the error signal for analyzing noise of the locked laser and for optimizing PID parameters
- Lock detection: Linien is capable of detecting loss of lock (temporarily disabled, use v0.3.2 if you rely in this feature
- Automatic relocking: if lock is lost, it relocks autonomously (temporarily disabled, use v0.3.2 if you rely in this feature)
- Machine learning is used to tune the spectroscopy parameters in order to optimize the signal
- Remote-controllable: the client libraries can be used to control or monitor the spectroscopy lock with Python.
- Combined FMS+MTS: Linien supports dual-channel spectroscopy that can be used to implement combined FMS+MTS
- Logging: Lock status and parameters can be logged to InfluxDB v2.
- Second integrator for slow control of piezo in an ECDL
- Additional analog outputs may be used using the GUI or python client (ANALOG_OUT 1, 2 and 3)
- 16 GPIO outputs may be programmed (e.g. for controlling other devices)
Linien runs on Windows and Linux. For Windows users the standalone binaries containing the graphical user interface are recommended. These binaries run on your lab PC and contain everything to get Linien running on your RedPitaya.
Both RedPitaya OS 1.x and 2.x are supported. However, support for OS 1.x will be dropped starting with Linien 2.x
If you want to use the python interface you should install it using pip.
You can download standalone binaries for Windows on the releases page (download the binary in the assets section of the latest version). For Linux users, we recommend installation via pip.
Linien is written for python 3 and can be installed using python's package manager pip:
pip install linien-guiThe GUI can be started by calling
linienin a terminal (on both Linux and Windows).
In case you're only interested in the python client and don't want to install the graphical application, you may use the linien-client package:
pip install linien-clientThe default setup looks like this:
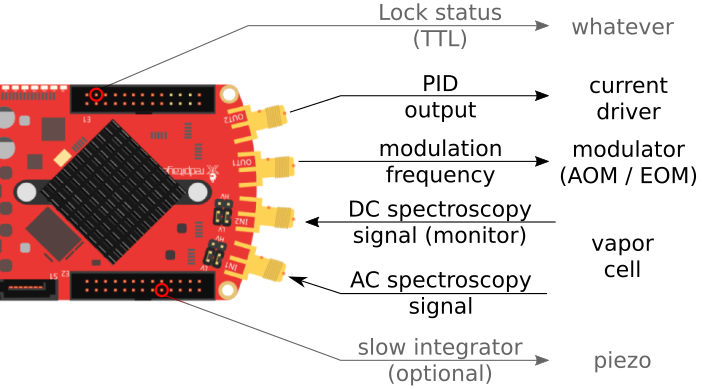
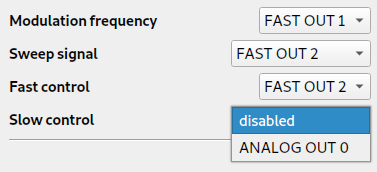
You can also configure Linien for different setups, e.g. if you want to have the modulation frequency and the control on the same output. Additionally, it is possible to set up a slow integrator on ANALOG OUT 0 (0 V to 1.8 V).
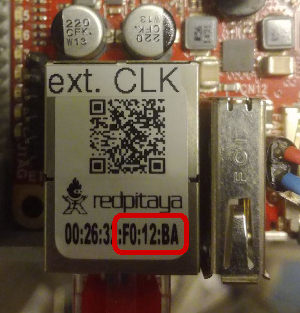
After launching Linien you should supply details of your RedPitaya. Its host address is usually given by
rp-XXXXXX.local, where XXXXXX are the last 6 digits of the device's MAC address. You will find them on a sticker on the ethernet port:
| ❗ If connecting using host name fails, try using RP's IP address instead |
|---|
Default value for user name and password is root (but you should probably change the password...).
When connecting to a RedPitaya for the first time, the Linien offers you to install the server component. Please note that this requires internet access on the RedPitaya (LAN access is not sufficient).
Once server libraries are installed, Linien will automatically run the server and connect to it. There's no need ever to start or stop anything on the server manually as the client takes care of this.
The server now operates autonomously: closing the client application doesn't have any influence on the lock status. You may also start multiple clients connecting to the same server.
The first thing to set up is the configuration of input and output signals:
Connect your AC spectroscopy signal to FAST IN 1. If you also want to monitor the DC spectroscopy signal, connect it to FAST IN 2.
Then, adapt the output signals to your needs:
When you're done, head over to Modulation, Sweep & Spectroscopy to configure modulation frequency and amplitude. Once your setup is working, you should see something like this:
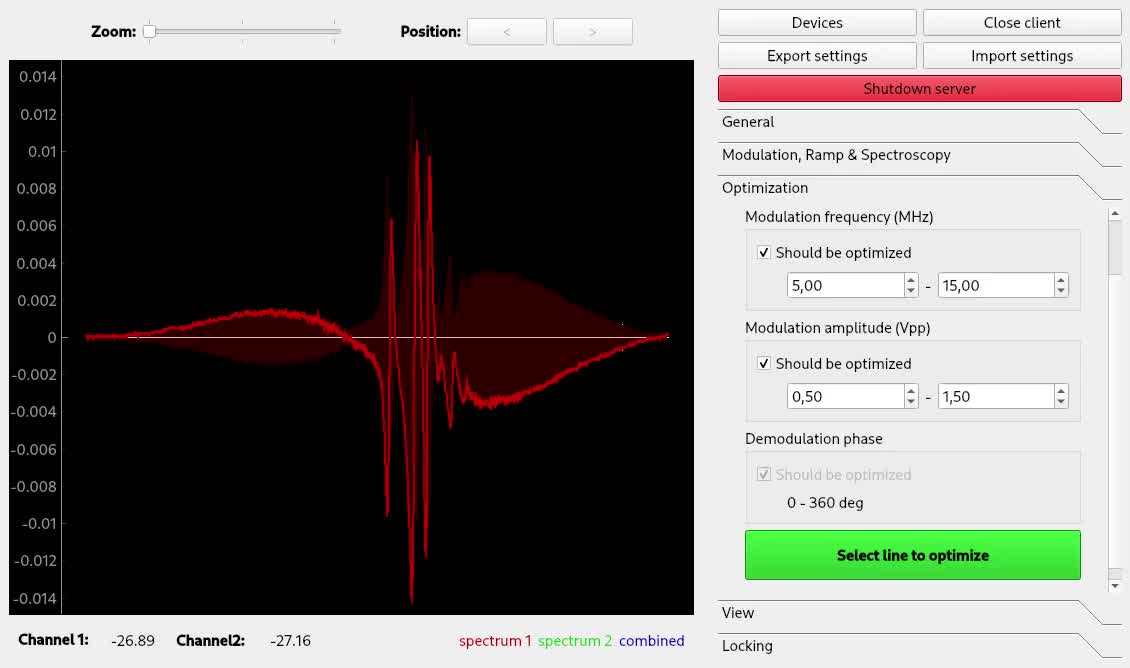
The bright red line is the demodulated spectroscopy signal. The dark red area is the signal strength obtained by iq demodulation, i.e. the demodulation signal obtained when demodulating in phase at this point.
PID-only mode is intended for bare PID operation (no demodulation or filtering), bypassing most of the FPGA functionality. If enabled, the signal flow is FAST IN 1 → PID → FAST OUT 2. This is useful, if aiming for a high control bandwidth: PID-only mode reduces propagation delay from 320 ns to 125 ns which may make a difference when phase-locking lasers.
Linien may use machine learning to maximize the slope of a line. As for the autolock, click and drag over the line you want to optimize. Then, the line is centered and the optimization starts. Please note that this only works if initially a distinguished zero-crossing is visible.
In order to use the autolock, enter some PID parameters first. Note that the sign of the parameters is determined automatically. After clicking the green button, you can select the line you want to lock to by clicking and dragging over it: your selection should contain both extrema of the line. The autolock will then center this line, decrease the scan range and try to lock to the middle between minimum and maximum contained in your selection.
The following options are available:
- Determine signal offset: If this checkbox is ticked, the autolock will adapt the y-offset of the signal such that the middle between minimum and maximum is at the zero crossing. This is especially useful if you have a large background signal (e.g. the Doppler background in FMS spectroscopy).
- Check lock: Directly after turning on the lock, the control signal is investigated. If it shifts too much, the lock is assumed to have failed.
- Watch lock: This option tells the Linien to continuously watch the control signal when the laser is locked. If steep changes are detected, a relock is initiated.
If you experience trouble with the autolock, this is most likely due to a bad signal-to-noise ratio or strong laser jitter.
Linien implements two different autolock algorithms:
- Robust mode: this algorithm runs on FPGA and analyzes the peak shapes in order to turn on the lock at the right sweep position. It is able to cope with a high amount of jitter as it runs completely on the FPGA, i.e. no delays due to communication between CPU and FPGA occur.
- Simple mode: this algorithm uses a simple calculation of auto-correlation on the CPU which is then used to specify at which point of the sweep the lock should start. This algorithm is less complex than the first one and may be used if you experience problems with jitter-tolerant mode. As it requires some communication between CPU and FPGA which causes some delay, it may have problems if the line jitters a lot.
By default, auto-detect mode is used: this mode chooses an algorithm based on the amount of jitter.
If you have problems with the autolock, you may also lock manually. Activate the Manual tab and use the controls in the top (Zoom and Position) to center the line you want to lock to. Choose whether the target slope is rising or falling and click the green button.
Linien has to option to log the lock status and parameters to an InfluxDB. Currently, only InfluxDB 2.x is supported. Logging can be configured via the Logging menu in the Linien GUI, but logging will continue even if the client is closed. Time stamps of the data points are determined by the InfluxDB, not by the RedPitaya. If updating/checking the InfluxDB credentials fails, there is additional information in the tool-tip of the fail indicator ❌.
The parameter names are documented in parameters.py. The signal_stats parameter does contain statistics of the input and output signals, e.g. control_signal_mean or monitor_signal_max.
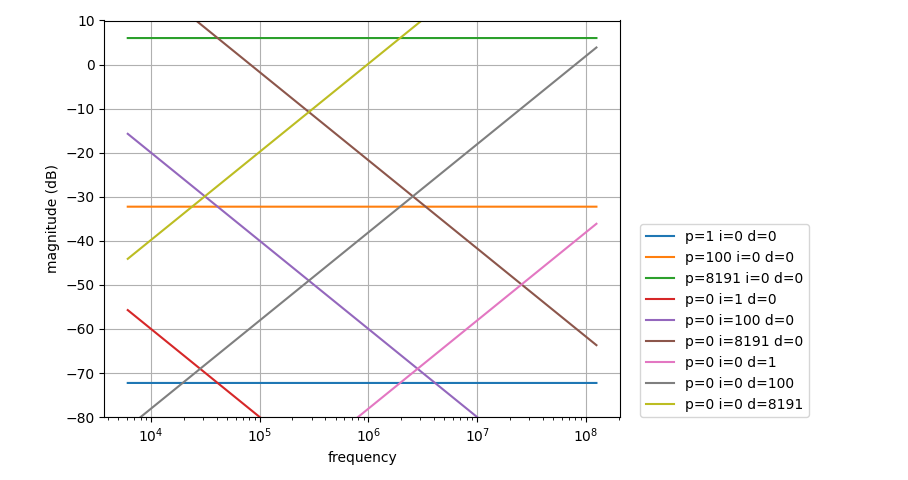
Transfer function of the PID is given by
L(f) = kp + ki / f + kd * f
with kp=P/4096, ki=I/0.1s and kd=D / (2**6 * 125e6).
Note that this equation does not account for filtering before the PID (cf. Modulation, Sweep & Spectroscopy tab).
In addition to the GUI, Linien can also be controlled using Python. For that purpose, installation via pip is required (see above).
Then, you should start the Linien server on your RedPitaya. This can be done by running the GUI client and connecting to the device (see above). Alternatively, the connect method of LinienClient has the option autostart_server.
Once the server is up and running, you can connect using python:
from linien_client.connection import LinienClient
from linien_common.common import  MHz, Vpp, ANALOG_OUT_V

c = LinienClient(
    host="rp-xxxxxx.local",
    user="root",
    password="root"
)
c.connect(autostart_server=True, use_parameter_cache=True)

# read out the modulation frequency
print(c.parameters.modulation_frequency.value / MHz)

# have a look at https://github.com/linien-org/linien/blob/master/linien/server/parameters.py
# for a documentation of all parameters that can be accessed and modified

# set modulation amplitude
c.parameters.modulation_amplitude.value = 1 * Vpp
# in the line above, we set a parameter. This is not written directly to the
# FPGA, though. In order to do this, we have to call write_registers():
c.connection.root.write_registers()

# additionally set ANALOG_OUT_1 to 1.2 volts DC (you can use this to control other devices of your experiment)
c.parameters.analog_out_1.value = 1.2 * ANALOG_OUT_V

# GPIO outputs can also be set
# each bit corresponds to a pin
# Example: enable all N pins and disable all P pins
c.parameters.gpio_n_out.value = 0b11111111
c.parameters.gpio_p_out.value = 0b00000000
# Example: enable the N pins 1-4 and disable N pins 5-8
c.parameters.gpio_n_out.value = 0b11110000 # 4 on, 4 off
# Example: enable every second P pin
c.parameters.gpio_p_out.value = 0b01010101 # 4 on, 4 off

# again, we have to call write_registers in order to write the data to the FPGA
c.connection.root.write_registers()

# it is also possible to set up a callback function that is called whenever a
# parameter changes (remember to call `check_for_changed_parameters()` periodically)
def callback(value):
    # this function is called whenever `my_param` changes on the server.
    # note that this only works if `check_for_changed_parameters` is called from
    # time to time as this function is responsible for checking for
    # changed parameters.
    print('parameter arrived!', value)

c.parameters.modulation_amplitude.add_callback(callback)

from time import sleep
for i in range(10):
    c.parameters.check_for_changed_parameters()
    if i == 2:
        c.parameters.modulation_amplitude.value = 0.1 * Vpp
    sleep(.1)

# plot control and error signal
import pickle
from matplotlib import pyplot as plt
plot_data = pickle.loads(c.parameters.to_plot.value)

# depending on the status (locked / unlocked), different signals are available
print(plot_data.keys())

# if unlocked, signal1 and signal2 contain the error signal of channel 1 and 2
# if the laser is locked, they contain error signal and control signal.
if c.parameters.lock.value:
    plt.title('laser is locked!')
    plt.plot(plot_data['control_signal'], label='control signal')
    plt.plot(plot_data['error_signal'], label='error signal')
else:
    plt.title('laser is sweeping!')
    plt.plot(plot_data['error_signal_1'], label='error signal channel 1')
    plt.plot(plot_data['error_signal_2'], label='error signal channel 2')

plt.legend()
plt.show()
For a full list of parameters that can be controlled or accessed have a
look at
parameters.py. Remember that changed parameters are not written to the FPGA unless c.connection.root.write_registers() is called.
The script below shows an example of how to run the autolock using the scripting interface:
import pickle
import numpy as np

from linien_client.connection import LinienClient
from linien_common.common import FAST_AUTOLOCK

from matplotlib import pyplot as plt
from time import sleep

c = LinienClient(
    host="rp-xxxxxx.local",
    user="root",
    password="root"
)
c.connect(autostart_server=True, use_parameter_cache=True)

c.parameters.autolock_mode_preference.value = FAST_AUTOLOCK


def wait_for_lock_status(should_be_locked):
    """A helper function that waits until the laser is locked or unlocked."""
    counter = 0
    while True:
        to_plot = pickle.loads(c.parameters.to_plot.value)
        is_locked = "error_signal" in to_plot

        if is_locked == should_be_locked:
            break

        counter += 1
        if counter > 10:
            raise Exception("waited too long")

        sleep(1)


# turn of the lock (if it is running)
c.connection.root.start_sweep()
# wait until the laser is unlocked (if required)
wait_for_lock_status(False)


# we record a reference spectrum
to_plot = pickle.loads(c.parameters.to_plot.value)
error_signal = to_plot["error_signal_1"]


# we plot the reference spectrum and ask the user where the target line is
plt.plot(error_signal)
plt.plot(to_plot["monitor_signal"])
plt.show()

print("Please specify the position of the target line. ")
x0 = int(input("enter index of a point that is on the left side of the target line: "))
x1 = int(input("enter index of a point that is on the right side of the target line: "))


# show the lock point again
plt.axvline(x0, color="r")
plt.axvline(x1, color="r")
plt.plot(error_signal)
plt.show()


# turn on the lock
c.connection.root.start_autolock(x0, x1, pickle.dumps(error_signal))


# wait until the laser is actually locked
try:
    wait_for_lock_status(True)
    print("locking the laser worked \o/")
except Exception:
    print("locking the laser failed :(")
Before installing a new version of Linien, open the previously installed client and click the "Shutdown server" button. Don't worry, your settings and parameters will be saved. Then you may install the latest client on your local PC as described in the getting started section above. The next time you connect to RedPitaya, Linien will install the matching server version.
Information about development can be found in the wiki.
There's no need to install anything on RedPitaya manually. Run the new version of Linien on your computer and connect to RedPitaya. You will see a dialog that allows you to install the corresponding server component.
No, this is not possible as Linien relies on a customized FPGA bitstream.
The propagation delay is roughly 320 ns in normal mode and 125 ns in PID-only mode.
Ethernet LED blinking was found to impact analog outputs of RedPitaya. As this may impact lock stability, Linien disables ethernet LED blinking when starting.
If you want to re-enable the LEDs, just stop the Linien server or restart your RedPitaya.
If the client fails to connect to a RedPitaya, first check whether you can ping it by executing
ping rp-f0xxxx.localin a command line. If this works, check whether you can connect via SSH:
ssh rp-f0xxxx.localon the command line. If this is successful, in order to to check whether the
linien-server is running, first confirm that there is a running screen session with
the name linien-server by executing screen -ls. If that is the case attach it by
running screen -r linien-server. If any errors occurred on the server side, they will
be displayed here. Please provide the output if you are reporting an
issue related to connection problems.
Note that there might be issues if openSSH server is running on the client, see here.
- make sure that your RedPitaya is connected to the internet
- if the orange LED stops blinking and RedPitaya becomes unresponsive, your SD card is probably faulty
If you are using Linien for your scientific work, please cite us as follows:
@article{Wiegand2022,
   author = {B. Wiegand and B. Leykauf and R. Jördens and M. Krutzik},
   doi = {10.1063/5.0090384},
   issn = {10897623},
   issue = {6},
   journal = {Review of Scientific Instruments},
   month = {6},
   pmid = {35778046},
   title = {Linien: A versatile, user-friendly, open-source FPGA-based tool for frequency stabilization and spectroscopy parameter optimization},
   volume = {93},
   year = {2022},
}
Linien ‒ User-friendly locking of lasers using RedPitaya (STEMlab 125-14) that just works.
Copyright © 2014-2015 Robert Jördens
Copyright © 2018-2022 Benjamin Wiegand
Copyright © 2021-2023 Bastian Leykauf
Copyright © 2022 Christian Freier
Linien is free software: you can redistribute it and/or modify it under the terms of the GNU General Public License as published by the Free Software Foundation, either version 3 of the License, or (at your option) any later version.
Linien is distributed in the hope that it will be useful, but WITHOUT ANY WARRANTY; without even the implied warranty of MERCHANTABILITY or FITNESS FOR A PARTICULAR PURPOSE. See the GNU General Public License for more details.
You should have received a copy of the GNU General Public License along with Linien. If not, see https://www.gnu.org/licenses/.
Development mainly takes place at Humboldt University of Berlin.
This work is supported by the German Space Agency (DLR) with funds provided by the Federal Ministry of Economics and Technology (BMWi) under grant number DLR50WM2066.
- RedPID: the basis of Linien


![pre-commit-ci[bot]](https://avatars.githubusercontent.com/u/66853113?size=120)
![dependabot[bot]](https://avatars.githubusercontent.com/u/49699333?size=120)


