metrics2mqtt
Publish cross-platorm system performance metrics to a MQTT broker.
metrics2mqtt is a lightweight wrapper around psutil that publishes CPU utilization, free memory, and other system-level stats to a MQTT broker. The primary use case is to collect system performance metrics for ingestion into Home Assistant (HA) for alerting, reporting, and firing off any number of automations. However, given the minimal nature of this code, it could be used for other purposes as well.
This project is intended to be an alternative to the (very good) Glances project. The primary design difference is that the Glances integration into Home Assistant relies on periodically polling a RESTful API. However, the pub/sub model of MQTT--which is already widely used in the home automation community--is an ideal fit for real-time reporting of this type of data. Additionally metrics2mqtt can be very lightweight because it omits the GUI and alerting elements of Glances (which are redundant when used in conjunction with HA).
30-Second Start Guide
From the computer you're wishing to collect metrics on:
pip install metrics2mqtt
metrics2mqtt --name MyServerName --cpu=60 --vm -vvvvv
This will install the latest release of metrics2mqtt, create the necessary MQTT topics, and start sending virtual memory and CPU utilization metrics. The MQTT broker is assumed to be running on localhost. If your broker is running on a different host, specify the hostname or IP address using the --broker parameter.
metrics2mqttrequires Python 3.6 or above. If your default Python version is older, you may have to explictly specify the pip version by using pip3 or pip-3.
- The
--nameparameter is used for the friendly name of the sensor in Home Assistant and for the MQTT topic names. If not specified, it defaults to the hostname of the machine. - Instantaneous CPU utilization isn't all that informative. It's normal for a CPU to occasionally spike to 100% for a few moments and means that the chip is being utilized to its full potential. However, if the CPU stays pegged at/near 100% over a longer period of time, it is indicative of a bottleneck. The
--cpu=60parameter is the collection interval for the CPU metrics. Here CPU metrics are gathered for 60 seconds and then the average value is published to MQTT state topic for the sensor. A good value for this option is anywhere between 60 and 1800 seconds (1 to 15 minutes), depending on typical workloads. - The
--vmflag indicates that virtual memory (RAM) metrics should also be published. -
-vvvvv(five v's) specifies debug-level logging to the console. Reduce the quantity of v's to reduce the logging verbosity.
By default, metrics2mqttwill publish system metrics every 300 seconds (5 minutes). This can be changed using the --interval option.
Additional Metrics
Disk Usage
metrics2mqtt can publish disk usage metrics using the du option. Multiple du options can be specified to monitor different volumes. Each volume will present as a separate sensor in Home Assistant. The sensor state reports the percentage of total volume space consumed. Additional data (total volume size in bytes, free bytes, and used bytes) are accessable as state attributes on each sensor.
Example
metrics2mqtt --name Server1 -vvvvv --cpu=60 --vm --du='/var/spool' --du='/'
Network Throughput
Network throughput (amount of traffic) metrics are also available. Using one or more --net parameters, specify the interface name and the collection interval (as discussed in the CPU metrics documenation), seperated by a comma. A seperate MQTT topic is created for each interface and each will appear as a seperate sensor in HA.
The sensor state equals average throughput of the interface during the collection interval (combining both transmit and receive) in kilobits per second. More detail is available in the state attributes, such as: individual TX and RX rates, number of packets, total bytes sent and received, etc. Except for TX and RX rates, all attribute values are total accumulated values since the interface was reset. Thus, expect to see very large numbers if the interface has been online a while.
Example
metrics2mqtt --name Server1 -vvvvv --interval 60 --net=eth0,15
This will publish network throughput information about Server1's eth0 interface to the MQTT broker once every 60 seconds. The sensor state will equal the average network throughput over the previous 15 seconds.
Compatibility
metrics2mqtt is cross-platform and has been tested to work on CentOS, Ubuntu, Windows 10, and Raspbian (Raspberry Pi). Python 3.6 (or above) is recommended.
Running in the Background (Daemonizing)
metrics2mqtt runs as a foreground task at the command prompt. In order to run in the program in the background, or automatically at boot, the process has to be daemonized. The easiest way to do this is on a UNIX-like OS (Linux/BSD) is with Supervisor. An example Supervisor configuration file for metrics2mqtt is included in the /contrib/ directory.
I am not familiar with how to daemonize a Python process as a Windows service. But I do know that it is possible with enough Googling. Documentation and code pull requests are very much welcome--especially on this topic.
Using with Home Assistant (HA)
Once metrics2mqtt is collecting data and publishing it to MQTT, it's rather trival to use the metrics in Home Assistant.
A few assumptions:
- Home Assistant is already configured to use a MQTT broker. Setting up MQTT and HA is beyond the scope of this documentation. However, there are a lot of great tutorials on YouTube. Either the (recently deprecated) internal broker, or preferably an external broker like Mosquitto will need to be installed and the HA MQTT intergration configured. I run both HA and Mosquitto in separate Docker containers on the same host and the config works well.
-
The HA MQTT integration is configured to use
homeassistantas the MQTT autodiscovery prefix. This is the default for the integration and also the default formetrics2mqtt. If you have changed this from the default, use the--prefixparameter to specify the correct one. -
You're not using TLS to connect to the MQTT broker. Currently
metrics2mqttonly works with unencrypted connections. Username / password authentication can be specified with the--usernameand--passwordparameters, but TLS encryption is not yet supported. If this is a feature you need, please post a feature request (or submit a pull request if you're the ambitious type).
Using the default prefix and a system name of NUC (the name of my server), the following state can be found in the "States" section of Developer Tools in HA:
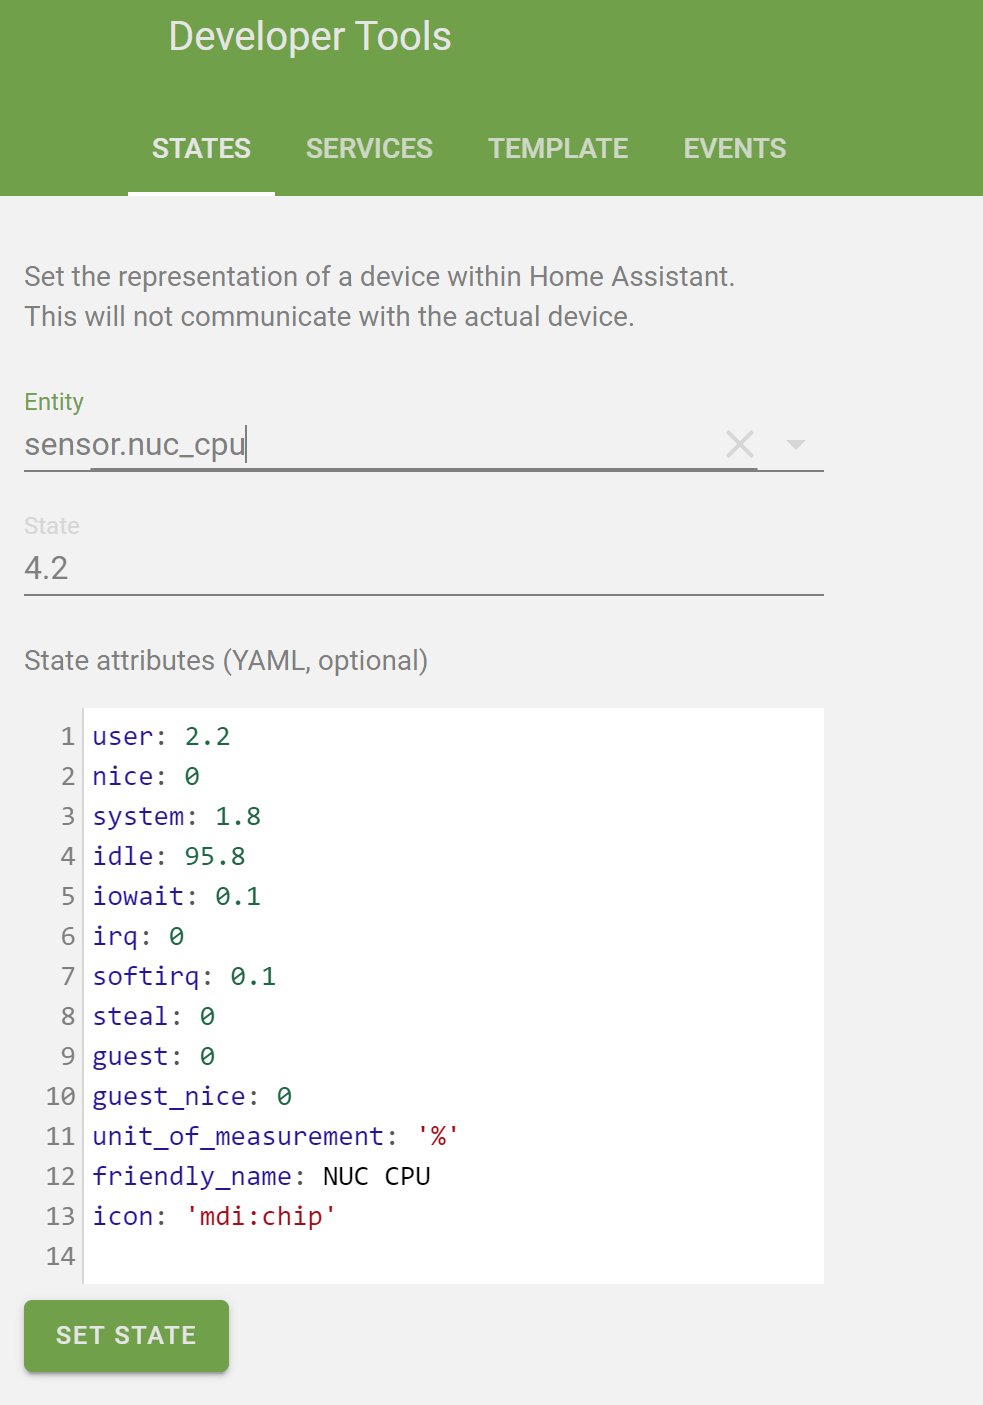
The state value is the overall CPU utilization as a percentage. A detailed breakdown of kernal vs userland time, I/O wait time, etc. appear as attributes. This can be tested in the template sandbox in the Developer Tools:
The NUC server recently had a CPU utlization of {{ states('sensor.nuc_cpu') }}%. This included executing user-space programs for {{state_attr('sensor.nuc_cpu', 'user')}}% of cycles.
Which displays something similar to: The NUC server recently had a CPU utlization of 3.1%. This included executing user-space programs for 1.9% of cycles.
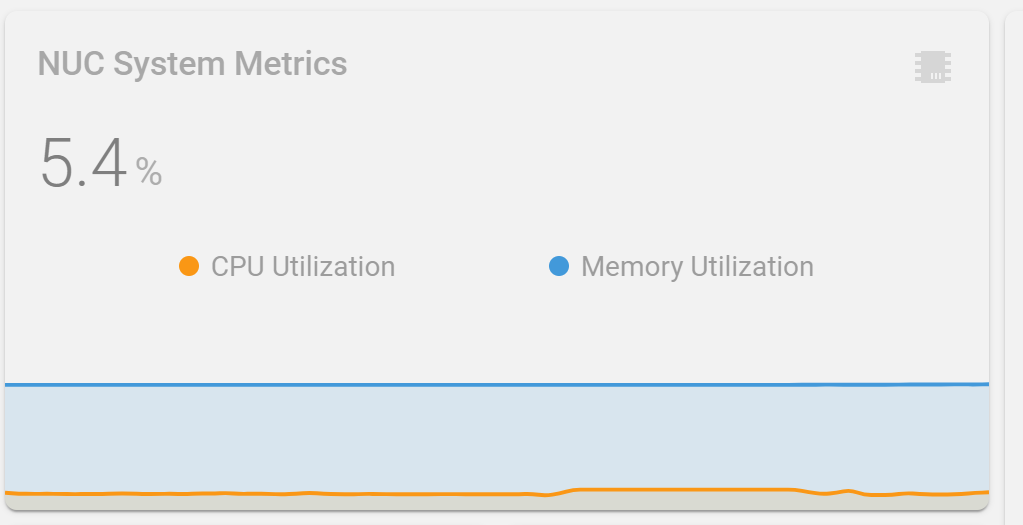
Lovelace Dashboards
I mostly use the excellent mini-graph-card custom card for my Lovelace dashboards. It's highly-customizable and fairly easy to make great looking charts in HA. Here is a very basic config example of using the metrics produced by metrics2mqtt to display the past 12 hours of CPU and memory utilization on my Intel NUC server:
entities:
  - entity: sensor.nuc_cpu
    name: CPU Utilization
    show_legend: true
    show_line: true
    show_points: false
  - entity: sensor.nuc_virtual_memory
    name: Memory Utilization
    show_legend: true
    show_line: true
    show_points: false
hours_to_show: 12
line_width: 2
lower_bound: 0
name: NUC System Metrics
points_per_hour: 6
show:
  labels: false
  labels_secondary: false
type: 'custom:mini-graph-card'
upper_bound: 100