 Imagen de vecstock en Freepik
Milanesas / EDA helper
Tired of wrangling data wrangling during EDA? Unleash the Python data analysis beast within with milanesas, your new secret weapon for effortless Exploratory Data Analysis!
Say goodbye to repetitive coding and hello to intuitive automation: visualize distributions, uncover missing values, identify relationships, and generate comprehensive reports – all with a few lines of code.
Stop drowning in data, start diving for insights with milanesas!
P.S. It's so user-friendly, even pandas ninjas will be impressed.
Features
- Functions to draw simple graphs.
- Functions for drawing orizontal and vertical comparative graphs.
- Functions for transforming percentage values.
- Functions for counting unique values.
Installation
Install my-project with pipy.
pip install milanesasUsage/Examples
import pandas as pd
import milanesas.eda_helper as eh #Importing the library.
# Create a test dataframe.
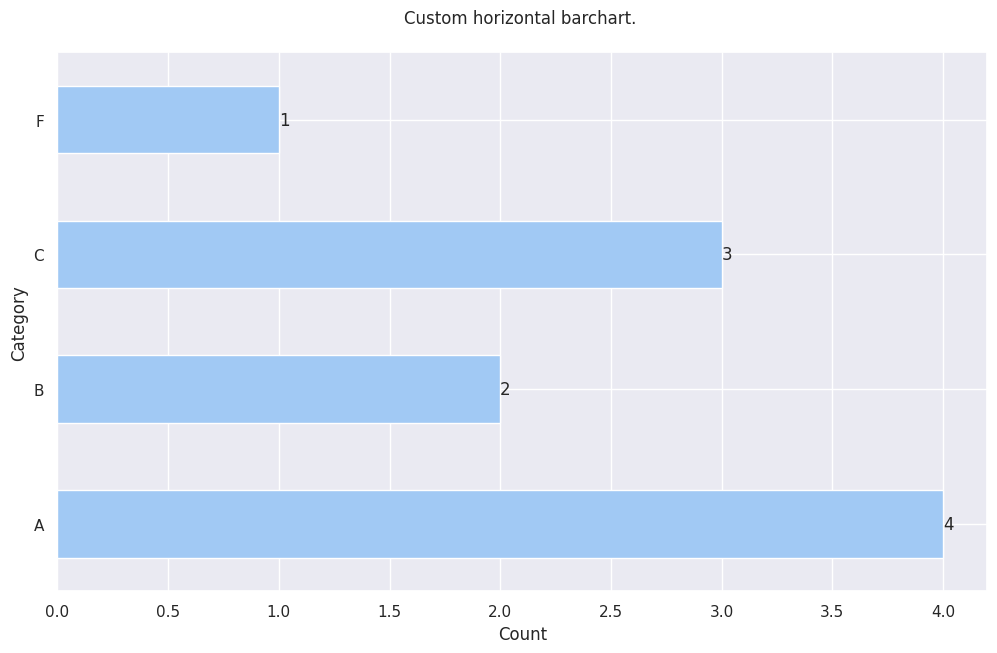
df = pd.DataFrame({'Category': ['A', 'B', 'F', 'C'], 'count': [4, 2, 3, 1]})
# Make a horizontal barchart.
eh.make_custom_horizontal_bar(
df,
"col",
"Custom horizontal bar chart.",
"Count",
"Category",
False)This simple code will show the following chart.
