ML_JDP4 Package
An integrated quantum mechanics-machine learning approach for ultra-fast NMR structural elucidation
Authors: Ariel M. Sarotti & María M. Zanardi
Usage: ml_jdp4
Installation Requirements
ML_JDP4.py needs python 3.8 or later to work. You could install the module by console using:
pip3 install ml-jdp4
User Guide
You need to create a folder containing the following files:
  1. The gaussian outputs of the NMR and NBO calculations (all conformers for all isomers).

  2. The excel file containing the experimental data and the labels of each nucleus associated with each experimental value.
Technical requirements
1) The output files: must be named following the next convention: number_*.log or .out, where number represent the isomer number and could be from 1 to N where N is the number of candidate structures under study. For instance:
   1_NewNatProd_c01.log (Conformer 1 for isomer 1 of the compound names NewNatProd)

   1_NewNatProd_c02.log (Conformer 2 for isomer 1 of the compound names NewNatProd)

   2_NewNatProd_c01.log (Conformer 1 for isomer 2 of the compound names NewNatProd)
The script allows the use of outputs form Gaussian03, 09 and 16.
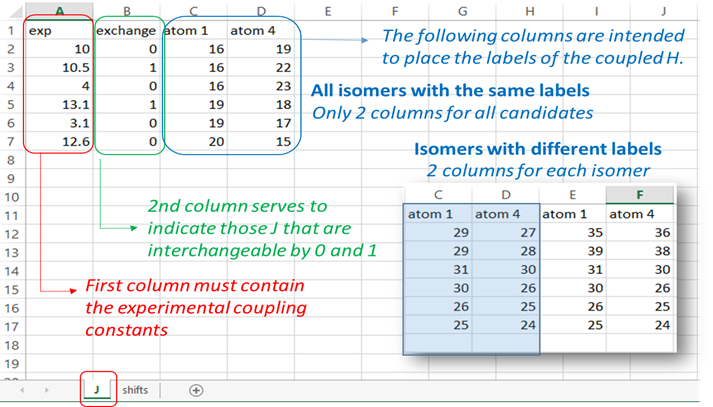
2) The input excel file: The experimental data and the labels of the candidate structures must be placed in an excel file following the next rules. The excel file should be constituted by two sheets; one containing the data for the coupling constants (named ‘J’) and the other with the NMR chemical shifts (named ‘shifts’).
“J” sheet: the first column “exp” should contain the experimental 3J coupling constants. In case of interchangeable values, they should be arranged “upside-down” (that is, the larger value first). The second column “exchange” serves to indicate 0 (not interchangeable value) or 1 (experimental data interchangeable with its following value). The third and fourth columns are intended to place the labels of the coupled protons. For cases when there are isomers with different labels, there should be two columns for each isomer as indicated below.
 {width=50%}
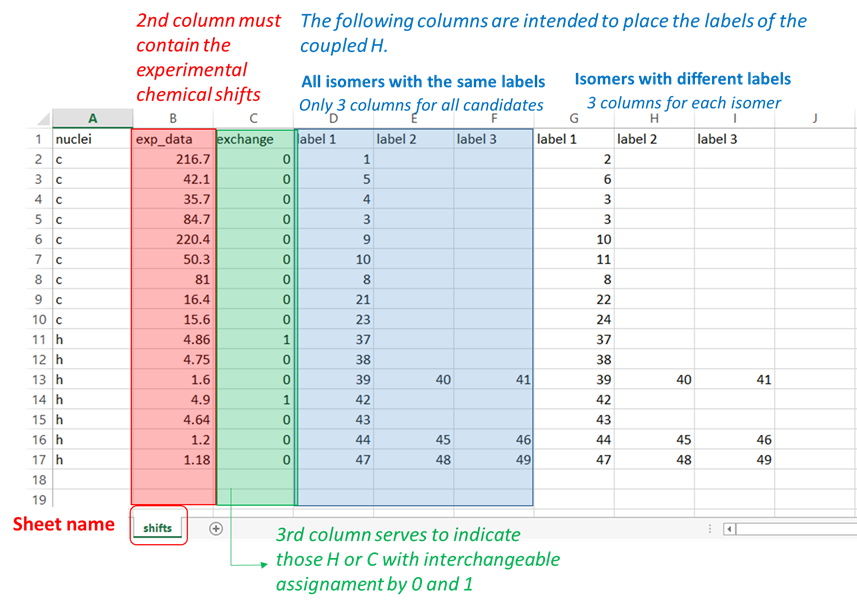
“shifts” sheet: the first column “nuclei” should contain the identity of the atom ‘c or C’ for 13C and ‘h or H’ for hydrogen atoms. The second column “exp_data” should contain the experimental chemical shifts. In case of interchangeable values, they should be arranged “upside-down” (that is, the larger value first). The third column “exchange” serves to indicate 0 (not interchangeable value) or 1 (experimental data interchangeable with its following value). The following columns are intended to place the labels of the nuclei associated to the corresponding chemical shift. If 2 or more values are added in that region, the isotropic shielding values will be averaged (as in the case of methyl groups or equivalent methylene groups). For cases when there are isomers with different labels, there should be three columns for each isomer as indicated in the Figure.
3) The output excel file: once the ML-J-DP4.py is executed, a filed named ‘Results_ML_J_DP4.xlsx’ is created in the same folder. The file contains five sheets:
DP4 sheet: tthe DP4 probabilities are shown for each isomer considering the information of H, C and J individually or altogether. Although the high accuracy in the ML predictions, it must be emphasized that some environments might not be correctly reproduced leading to large unscaled errors that would affect the scaling procedure and the concomitant J-DP4 values. Hence, to avoid potential misassignments, a sheet containing the unscaled shifts and errors are printed. In this scenario, it is advisable to recompute J-DP4 after removing or revising the conflicting signal.

Unscaled Chemical Shifts sheet: this sheet will be labeled as “Shifts_Unsc”, it displays the experimental chemical shifts (13C and 1H) and the coupling constants (3J), in that order, along with the predicted values for each isomer.

Scaled Chemical Shifts sheet: this sheet will be labeled as “Shifts”, it displays the experimental chemical shifts (13C and 1H) and the coupling constants (3J), in that order, along with the predicted values after the scaling process for each isomer.

Unscaled Errors sheet: this sheet will be labeled as “Unsc_Errors”, it displays the differences (absolute value) between Unscaled and experimental chemical shifts and coupling constants. It is necessary to check this sheet to verify that there are no nucleus with excessively large errors that could lead to an incorrect assignment.

Errors sheet: it displays the differences (absolute value) between scaled and experimental chemical shifts and coupling constants.

Case study: (-)-Menthol
In order to illustrate the ML-dJ-DP4 and the ML-iJ/dJ-DP4 workflows, we present the analysis of (-)-menthol following these two approaches. As indicated in the Figure 1, there are four possible isomers.

Figure 1
Following the recommended computational procedure, a total number of 123 conformers were found at the MMFF force field. Each structure was submitted to NMR calcualtions at the RHF/STO-3G level (with the pop=nbo option). The corresponding output files are provided in the Folder “menthol_ML_dJ-DP4”. According to Gaussian numbering scheme, the labels corresponding to each nuclei is given in Figure 2.

Figure 2. Carbon label followed by its corresponding proton(s) label(s) between parenthesis
ML-dJ-DP4
The input excel file required for running the ML-J-DP4.py script is filled out as follows. The Excel file is also provided in the folder “menthol_ML_dJ-DP4”. J sheet

Shifts sheet

Once the script is run, the resulting excel report file “Results_ML_J_DP4” will be generated. The output Excel file is provided in the folder “menthol_ML_dJ-DP4”.
DP4 sheet:

ML-iJ/dJ-DP4
This approach involves removing unsuitable conformations that are incompatible with selected experimental 3JHH values. In this case, we selected the J16,19= 10 Hz to constrain the sampling, leading to 34 conformations.

Figure 3. J16,19 (10 Hz) was chosen to constrain the conformations
Once removed the unsuitable conformations, the remaining conformations are submitted to GIAO NMR calculations at the RHF/STO-3G level with the pop=nbo option. The resulting output files are given in the folder “menthol_ML_iJ-dJ-DP4”. It is important to note that in this method, the selection of the conformations should be done before running the ML-J-DP4.py script. The Excel file with the experimental data is the same as in the dJ-DP4 analysis, but leaving out the information of the 3JHH used to filter the conformations.

J sheet:
Once the script is run, the resulting excel report file “Results_ML_J_DP4” will be generated. The output Excel file is provided in the folder “menthol_ML_iJ-dJ-DP4”.

DP4 sheet:
