


ncvis
NCVis is an efficient solution for data visualization and dimensionality reduction. It uses HNSW to quickly construct the nearest neighbors graph and a parallel (batched) approach to build its embedding. Efficient random sampling is achieved via PCGRandom. Detailed application examples can be found here.
Why NCVis?
It is Fast
We use preprocessed samples from the News Headlines Of India dataset to perform the comparison. Test cases are generated by taking the first 1000, 2 · 1000, . . . , 2¹⁰ · 1000 samples from the dataset. Given the same amount of time NCVis allows to process more than double number of samples compared to other methods, visualizing 10⁶ points in only 6 minutes (12 × Intel® CoreTM i7-8700K CPU @ 3.70GHz, 64 Gb RAM).

It is Efficient
One can define efficiency as the ratio of the time to execute the task on a single processor to the time on multiple processors. Ideally, the efficiency should be equal to the num- ber of threads. NCVis does not achieve this limit but signifi- cantly outperforms other methods. We used 10000 samples from the News Headlines Of India dataset.

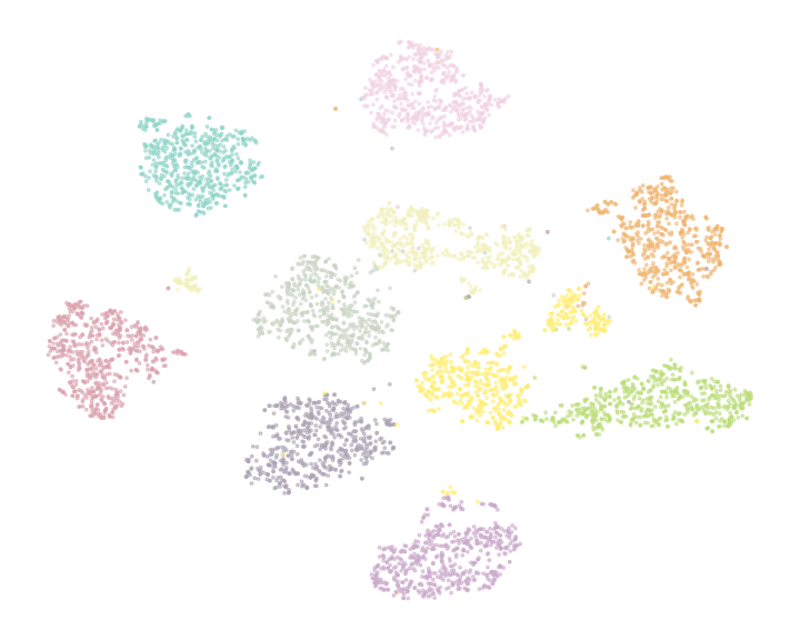
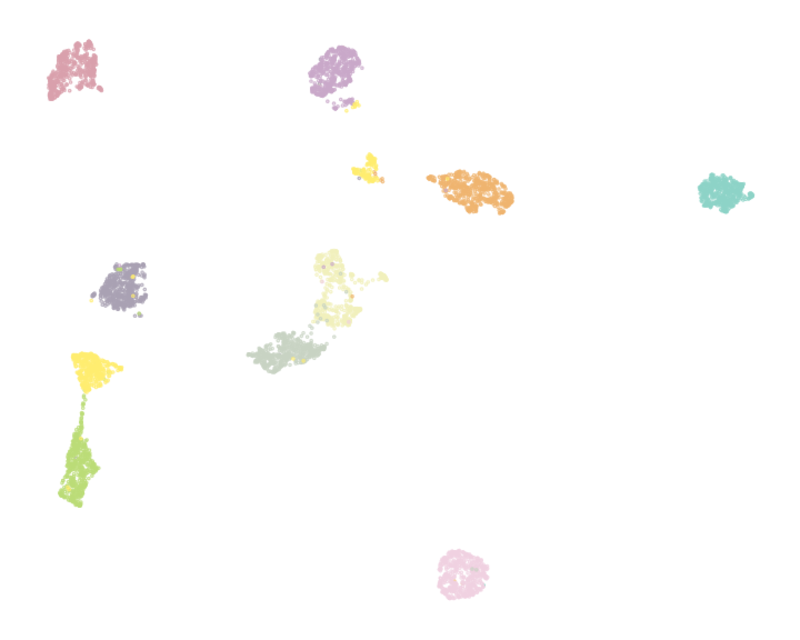
It is Predictable
It is important that the proposed method has predictable behavior on simple datasets. We used the Optical Recognition of Handwritten Digits Data Set which comprised 5620 preprocessed handwritten digits and thus has a simple structure that is assumed to be revealed by visualization. NCVis shows the behavior consistent with classical methods like t-SNE while producing visualization up to the order of magnitude faster.
| t-SNE (29.5s) | FIt-SNE (17.4s) |
|---|---|
 |
 |
| Multicore t-SNE (14.3s) | LargeVis (9.7s) |
|---|---|
 |
 |
| Umap (7.5s) | NCVis (0.9s) |
|---|---|
 |
 |
Using
import ncvis

vis = ncvis.NCVis()
Y = vis.fit_transform(X)
More detailed examples can be found here.
Installation
Conda [recommended]
You do not need to setup the environment if using conda, all dependencies are installed automatically. Using conda-forge channel is preferred, but using alartum channel is also possible in case of any issues with conda-forge.
$ conda install conda-forge::ncvis or
$ conda install alartum::ncvis Pip [not recommended]
Important: be sure to have a compiler with OpenMP support. GCC has it by default, which is not the case with clang. You may need to install llvm-openmp library beforehand.
- Install numpy, cython and pybind11 packages (compile-time dependencies):
$ pip install numpy cython pybind11
- Install ncvis package:
$ pip install ncvis
From source [not recommended]
Important: be sure to have OpenMP available.
First of all, download the pcg-cpp and hnswlib libraries:
$ make libsPython Wrapper
If conda environment is used, it replaces library search paths. To prevent compilation errors, you either need to use compilers provided by conda or switch to pip and system compilers.
-
Conda
$ conda install -c conda-forge cxx-compiler c-compiler conda-build numpy cython pybind11 scipy $ conda-develop -bc . -
Pip
$ pip install numpy cython pybind11
$ make wrapper
You can then use pytest to run some basic checks
$ pytest -v recipe/test.pyC++ Binary
-
Release
$ make ncvis
-
Debug
$ make debug
Citation
The original paper can be found here. If you use NCVis, we kindly ask you to cite:
@inproceedings{10.1145/3366423.3380061,
author = {Artemenkov, Aleksandr and Panov, Maxim},
title = {NCVis: Noise Contrastive Approach for Scalable Visualization},
year = {2020},
isbn = {9781450370233},
publisher = {Association for Computing Machinery},
address = {New York, NY, USA},
url = {https://doi.org/10.1145/3366423.3380061},
doi = {10.1145/3366423.3380061},
booktitle = {Proceedings of The Web Conference 2020},
pages = {2941–2947},
numpages = {7},
keywords = {dimensionality reduction, noise contrastive estimation, embedding algorithms, visualization},
location = {Taipei, Taiwan},
series = {WWW ’20}
}
