Neural Response Map
Neural Response Map is a tool that allows you to graphically detect the activations of artificial neural networks. To do this, the correlation between neuron activations is calculated and then t-SNE is applied to reduce the dimension. In this way the correlated neurons are plotted close to each other. This process allows observing the activation of neurons and obtaining the response to different stimuli such as the graphs presented by DeepMind in his paper.
Instalation
To install you can use the following command
pip install neural-response-mapQuick Start
To make use of the tool, first import the components
from neural_response_map import NeuralResponseMapThen you need to instantiate the class. For this you must pass the tensorflow model as a parameter
nrm = NeuralResponseMap(model)Next you need to train the mapper. This function calculates the correlation between the neurons and performs the dimensionality reduction for subsequent graphs. For this you must pass the inputs as a parameter. The inputs are sample input data of the neural network, for example if your network is a VGG16, the inputs are images of your dataset. Also, if you wish, you can pass the layers you want to view as a parameter. If you don't pass the layers as a parameter, the visualization will use all the layers of the model.
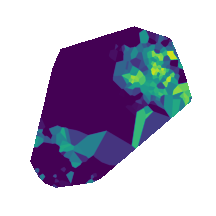
nrm.TrainMap(inputs, model.layers[:2])Finally you can visualize your Neural Response Map. To perform the visualization you must call GenerateMap and pass as a parameter the input examples that you want to visualize. If you pass more than one example, the display will be the average of all the Neural Response Maps of the input data.
nrm.GenerateMap(inputs[1:2])
GenerateMap allows other optional parameters:
- method: this parameter controls the display method which can be linear or nearest. The linear method performs a linear interpolation between the values of the neuron's activations. Nearest, on the other hand, does not perform interpolation. The nearest method is the default value.
- cmap: it is the color map that you want to use, by default it is viridis. If you want to know other visualization maps visit the following link.
- size: it is the size of the image. This value is a tuple with (5,5) by default.
- file: is the name and type of file in which you want to save the image (for example 'map.png'). If no path is passed the image is not saved.
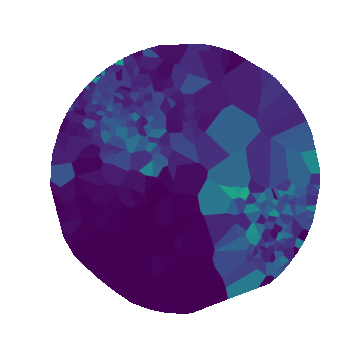
Alternatively after the TrainMap call, you can call CircleProjection. This will make the Neural Response Map more circular in shape.
nrm.CircleProjection()nrm.GenerateMap(inputs[1:2])

Authors
This package has been developed by:
