NOAWClg


Library for getting the world data climate from the data noaa/nasa
Instalation
$ pip3 install noawcgl -Unote: netcdf=1.5.7 | xarray=0.20.1
Examples
getting data
from a point
getting the data:
from noawclg import get_noaa_data as gnd

point = (-9.41,-40.5)

data = gnd.get_data_from_point(point)

# a example for the surface temperature
data = {'time':data['time'],'data':data['tmpsfc']}

print(data){'time': <xarray.IndexVariable 'time' (time: 129)>
array(['2022-01-01T00:00:00.000000000', '2022-01-01T03:00:00.000000000',
'2022-01-01T06:00:00.000000000', '2022-01-01T09:00:00.000000000',
'2022-01-01T12:00:00.000000000',
...keys
you can see the all keys in it page.
>>> from noawclg import get_noaa_data as gnd
>>> gnd().get_noaa_keys()
{'time': 'time',
'lev': 'altitude',
'lat': 'latitude',
'lon': 'longitude',
'absvprs': '** (1000 975 950 925 900.. 10 7 4 2 1) absolute vorticity [1/s] ',
'no4lftxsfc': '** surface best (4 layer) lifted index [k] ',
'acpcpsfc': '** surface convective precipitation [kg/m^2] ',
'albdosfc': '** surface albedo [%] ',
'apcpsfc': '** surface total precipitation [kg/m^2] ',
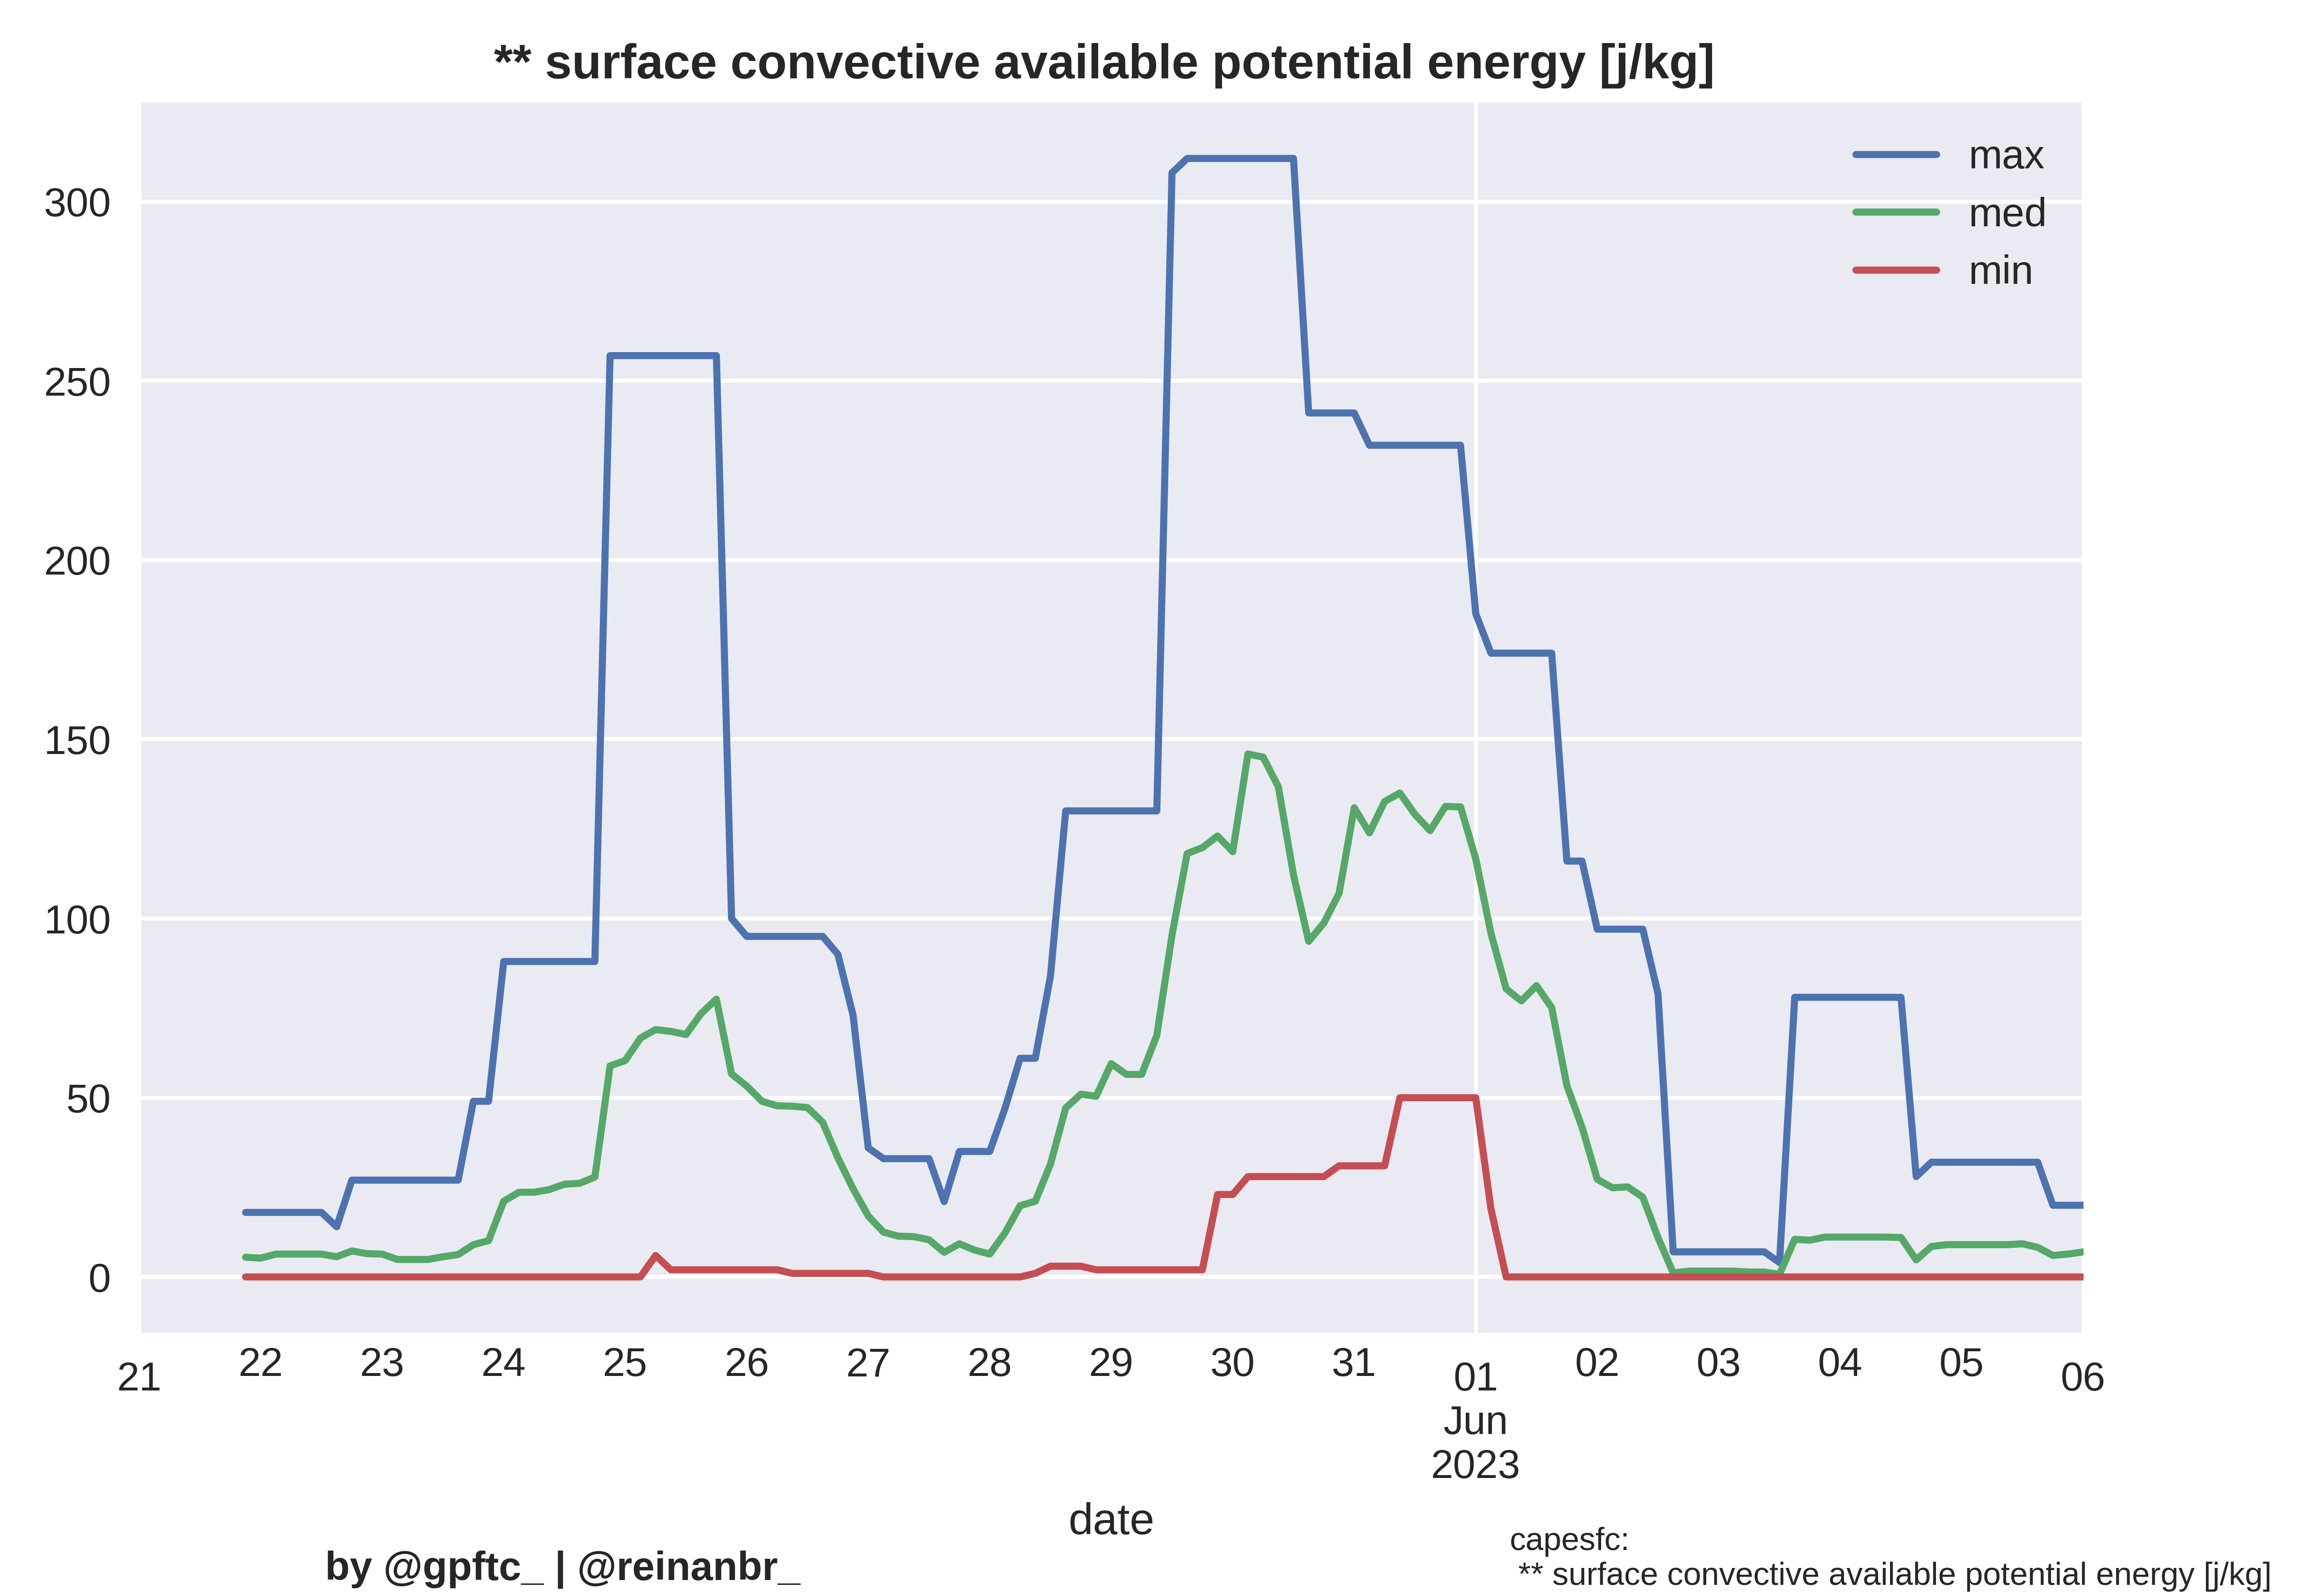
'capesfc': '** surface convective available potential energy [j/kg] ',
...example plot wind
import noawclg.main as main
from noawclg.main import get_noaa_data as gnd
from noawclg.plot import plot_data_from_place as pdp
import matplotlib.pyplot as plt
#plt.style.use('dark_background')
#reinan voltou, porrrrraaaaaaaaa

date_base = '12/01/2023'

main.set_date(date_base)
data_noaa = gnd()#,url_data='https://nomads.ncep.noaa.gov/dods/gfs_1p00/gfs20220108/gfs_1p00_00z')

place = 'juazeiro BA'

jua_pet = pdp(place=place,data=data_noaa)

jua_pet.path_file='plot_wind100m.png'

jua_pet.key_noaa='tmp80m'
jua_pet.title='Temperatura do Ar\nPetrolina-PE/Juazeiro-BA'
jua_pet.ylabel='°C'
jua_pet.xlabel='Janeiro de 2023'

def fmt_data(data): return data-273
jua_pet.fmt_data =  fmt_data

jua_pet.render()
#plt.show()
result: