To install run
pip install parallelplot
"""
Parallel Plot Demo with Wine Quality Dataset

"""

# Import libraries
import numpy as np
import pandas as pd
import matplotlib.pyplot as plt
import matplotlib.cm as cm

import parallelplot.plot as pp
from parallelplot.cmaps import purple_blue
# Function to download and load the wine quality dataset
def load_wine_quality_dataset():
# URLs for the Wine Quality datasets
red_wine_url = "https://archive.ics.uci.edu/ml/machine-learning-databases/wine-quality/winequality-red.csv"
white_wine_url = "https://archive.ics.uci.edu/ml/machine-learning-databases/wine-quality/winequality-white.csv"
# Download and read the datasets
red_wine = pd.read_csv(red_wine_url, sep=';')
white_wine = pd.read_csv(white_wine_url, sep=';')
# Add a wine type column
red_wine['wine_type'] = 'red'
white_wine['wine_type'] = 'white'
# Combine the datasets
wine_df = pd.concat([red_wine, white_wine], axis=0, ignore_index=True)
return wine_df
wine_df = load_wine_quality_dataset()print("Wine Quality Dataset:")
wine_dfWine Quality Dataset:
<style scoped>
.dataframe tbody tr th:only-of-type {
vertical-align: middle;
}
</style>
.dataframe tbody tr th {
    vertical-align: top;
}

.dataframe thead th {
    text-align: right;
}
| fixed acidity | volatile acidity | citric acid | residual sugar | chlorides | free sulfur dioxide | total sulfur dioxide | density | pH | sulphates | alcohol | quality | wine_type | |
|---|---|---|---|---|---|---|---|---|---|---|---|---|---|
| 0 | 7.4 | 0.70 | 0.00 | 1.9 | 0.076 | 11.0 | 34.0 | 0.99780 | 3.51 | 0.56 | 9.4 | 5 | red |
| 1 | 7.8 | 0.88 | 0.00 | 2.6 | 0.098 | 25.0 | 67.0 | 0.99680 | 3.20 | 0.68 | 9.8 | 5 | red |
| 2 | 7.8 | 0.76 | 0.04 | 2.3 | 0.092 | 15.0 | 54.0 | 0.99700 | 3.26 | 0.65 | 9.8 | 5 | red |
| 3 | 11.2 | 0.28 | 0.56 | 1.9 | 0.075 | 17.0 | 60.0 | 0.99800 | 3.16 | 0.58 | 9.8 | 6 | red |
| 4 | 7.4 | 0.70 | 0.00 | 1.9 | 0.076 | 11.0 | 34.0 | 0.99780 | 3.51 | 0.56 | 9.4 | 5 | red |
| ... | ... | ... | ... | ... | ... | ... | ... | ... | ... | ... | ... | ... | ... |
| 6492 | 6.2 | 0.21 | 0.29 | 1.6 | 0.039 | 24.0 | 92.0 | 0.99114 | 3.27 | 0.50 | 11.2 | 6 | white |
| 6493 | 6.6 | 0.32 | 0.36 | 8.0 | 0.047 | 57.0 | 168.0 | 0.99490 | 3.15 | 0.46 | 9.6 | 5 | white |
| 6494 | 6.5 | 0.24 | 0.19 | 1.2 | 0.041 | 30.0 | 111.0 | 0.99254 | 2.99 | 0.46 | 9.4 | 6 | white |
| 6495 | 5.5 | 0.29 | 0.30 | 1.1 | 0.022 | 20.0 | 110.0 | 0.98869 | 3.34 | 0.38 | 12.8 | 7 | white |
| 6496 | 6.0 | 0.21 | 0.38 | 0.8 | 0.020 | 22.0 | 98.0 | 0.98941 | 3.26 | 0.32 | 11.8 | 6 | white |
6497 rows × 13 columns
# Example 1: Basic parallel plot with default style
fig1, axes1 = pp.plot(
    df=wine_df,
    target_column='quality',
    title="Wine Quality Dataset - All Features",
    figsize=(16, 8),
    tick_label_size=10,
    alpha=0.3,
    cmap=cm.hot,
    order='max',
    lw=0.5,

)
plt.show()
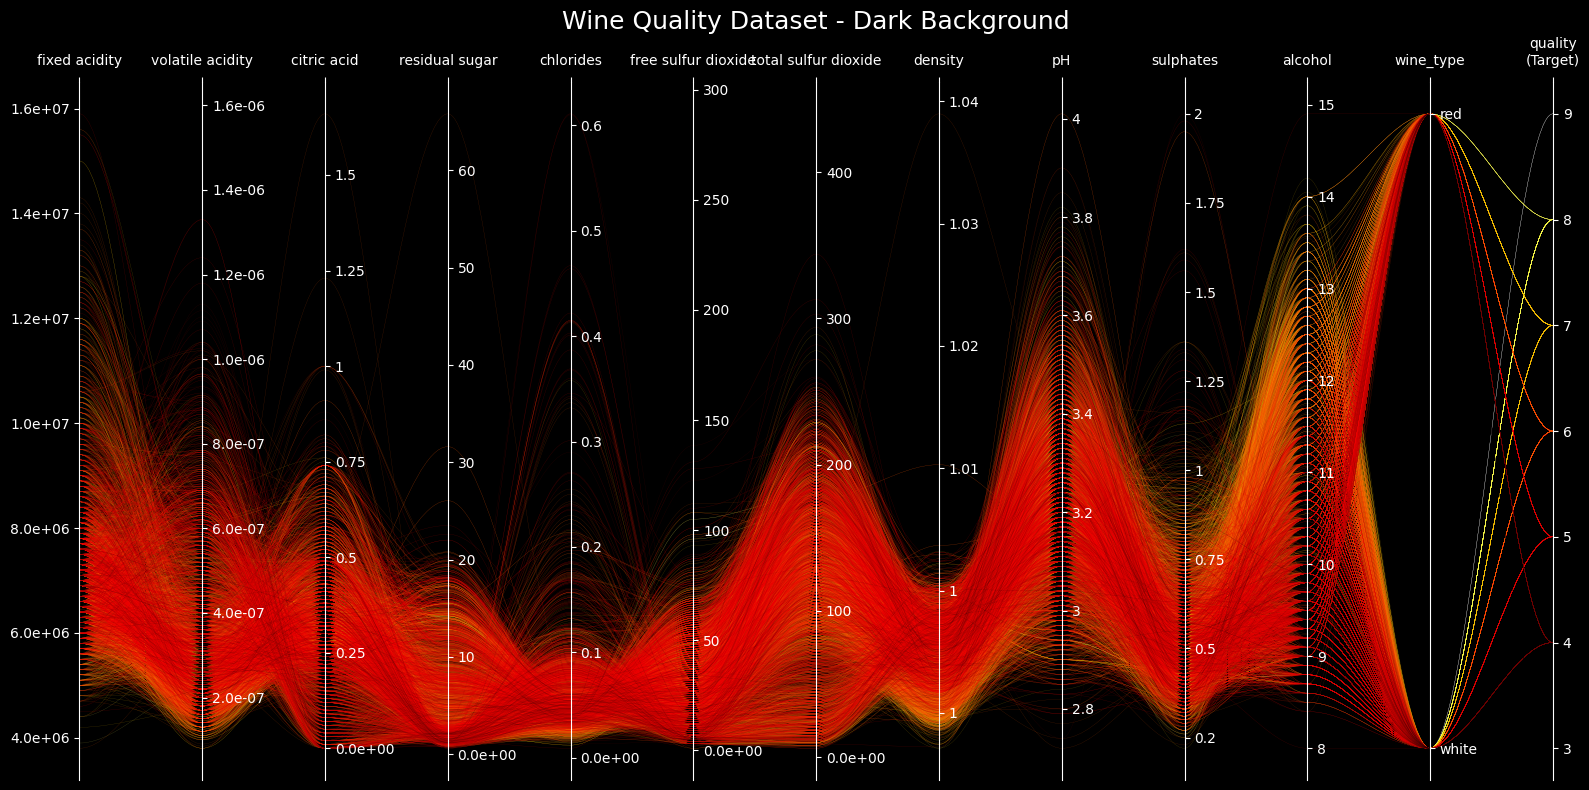
# Example 2: Parallel plot with dark background
fig2, axes2 = pp.plot(
    df=wine_df,
    target_column='quality',
    title="Wine Quality Dataset - Dark Background",
    figsize=(16, 8),
    style="dark_background",
    lw=0.2,
    # axes_to_reverse = [0, 1, 2, 5]
)
plt.show()
# Example 3: Different cmap
fig3, axes3 = pp.plot(
    df=wine_df,
    target_column='quality',
    title="Wine Quality Dataset - Colored by Wine Type",
    figsize=(16, 8),
    cmap=purple_blue,
    style="dark_background",
    lw=0.1,
    order='min',
    alpha = 0.2,
    axes_to_reverse = [1,2]
)
plt.show()
# Example 4: Select top features with highest correlation to quality
# Calculate correlations with quality
corr_with_quality = wine_df.drop(columns=['wine_type']).corr()['quality'].abs().sort_values(ascending=False)
top_features = corr_with_quality.index[:8]  # Top 8 features

# Create subset with only the top features
wine_top_features = wine_df[top_features]

fig4, axes4 = pp.plot(
    df=wine_top_features,
    target_column='quality',
    title="Wine Quality - Top Correlated Features",
    figsize=(14, 7),
    cmap=cm.viridis,
    style="dark_background",
    lw=0.2,
    axes_to_reverse = [1,2]


)
plt.show()
# Example 3: Different cmap
fig3, axes3 = pp.plot(
    df=wine_df,
    target_column='quality',
    title="Wine Quality Dataset - Colored by Wine Type",
    figsize=(16, 8),
    cmap=cm.plasma,
    style="dark_background",
    lw=0.1,
    axes_to_reverse = [1,2]

)
plt.show()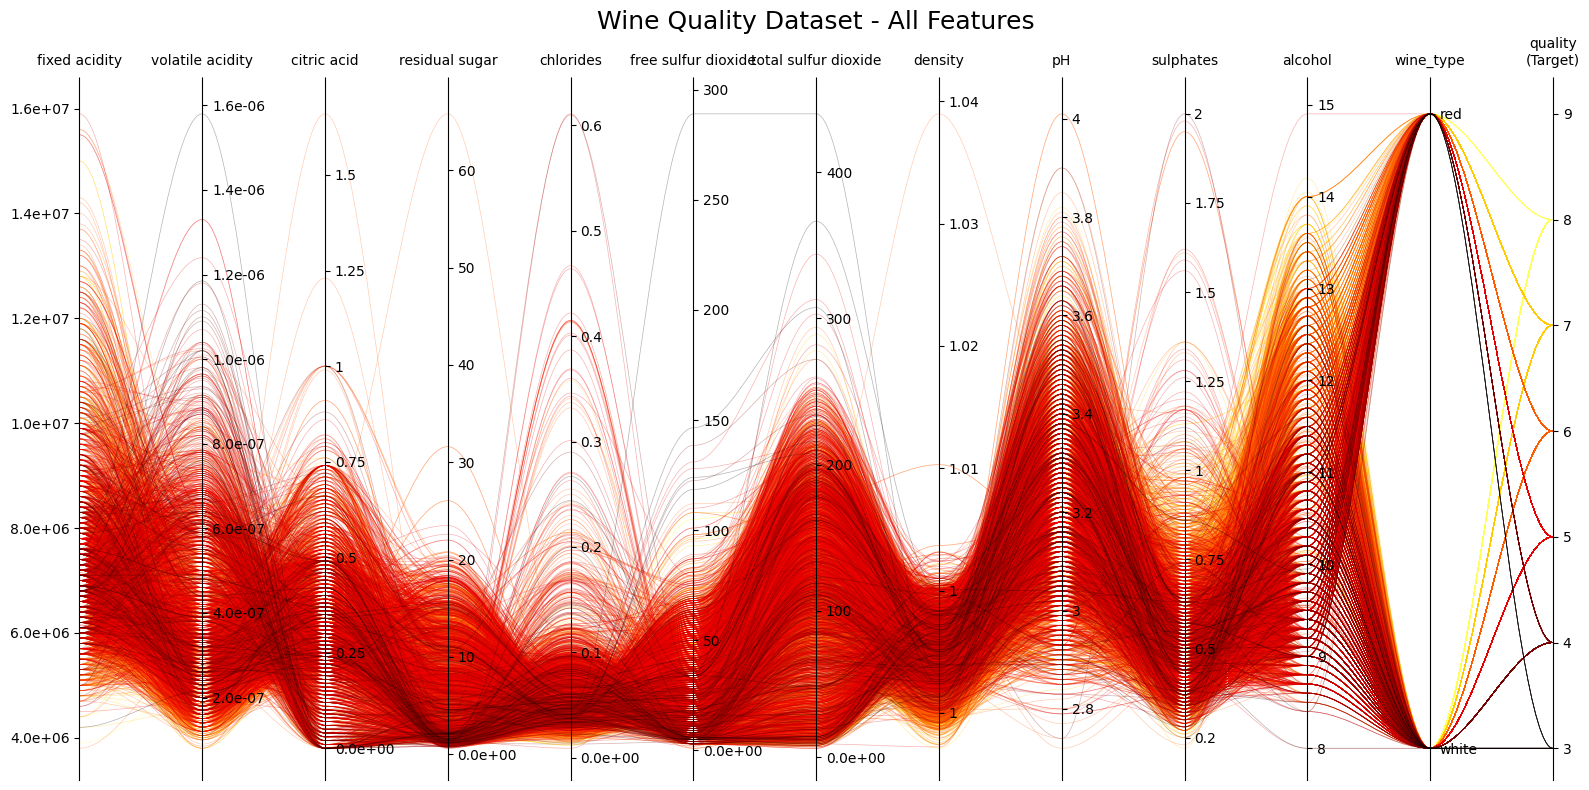
# Example 3: Different cmap and hide all axes
fig3, axes3 = pp.plot(
    df=wine_df,
    target_column='quality',
    title="Wine Quality Dataset - Colored by Wine Type",
    figsize=(16, 8),
    cmap=cm.cool.reversed(),
    style="dark_background",
    lw=0.1,
    # order='random',
    hide_axes=True,
    axes_to_reverse = [0]


)
plt.show()