![]()


![]()
popmon is a package that allows one to check the stability of a dataset. popmon works with both pandas and spark datasets.
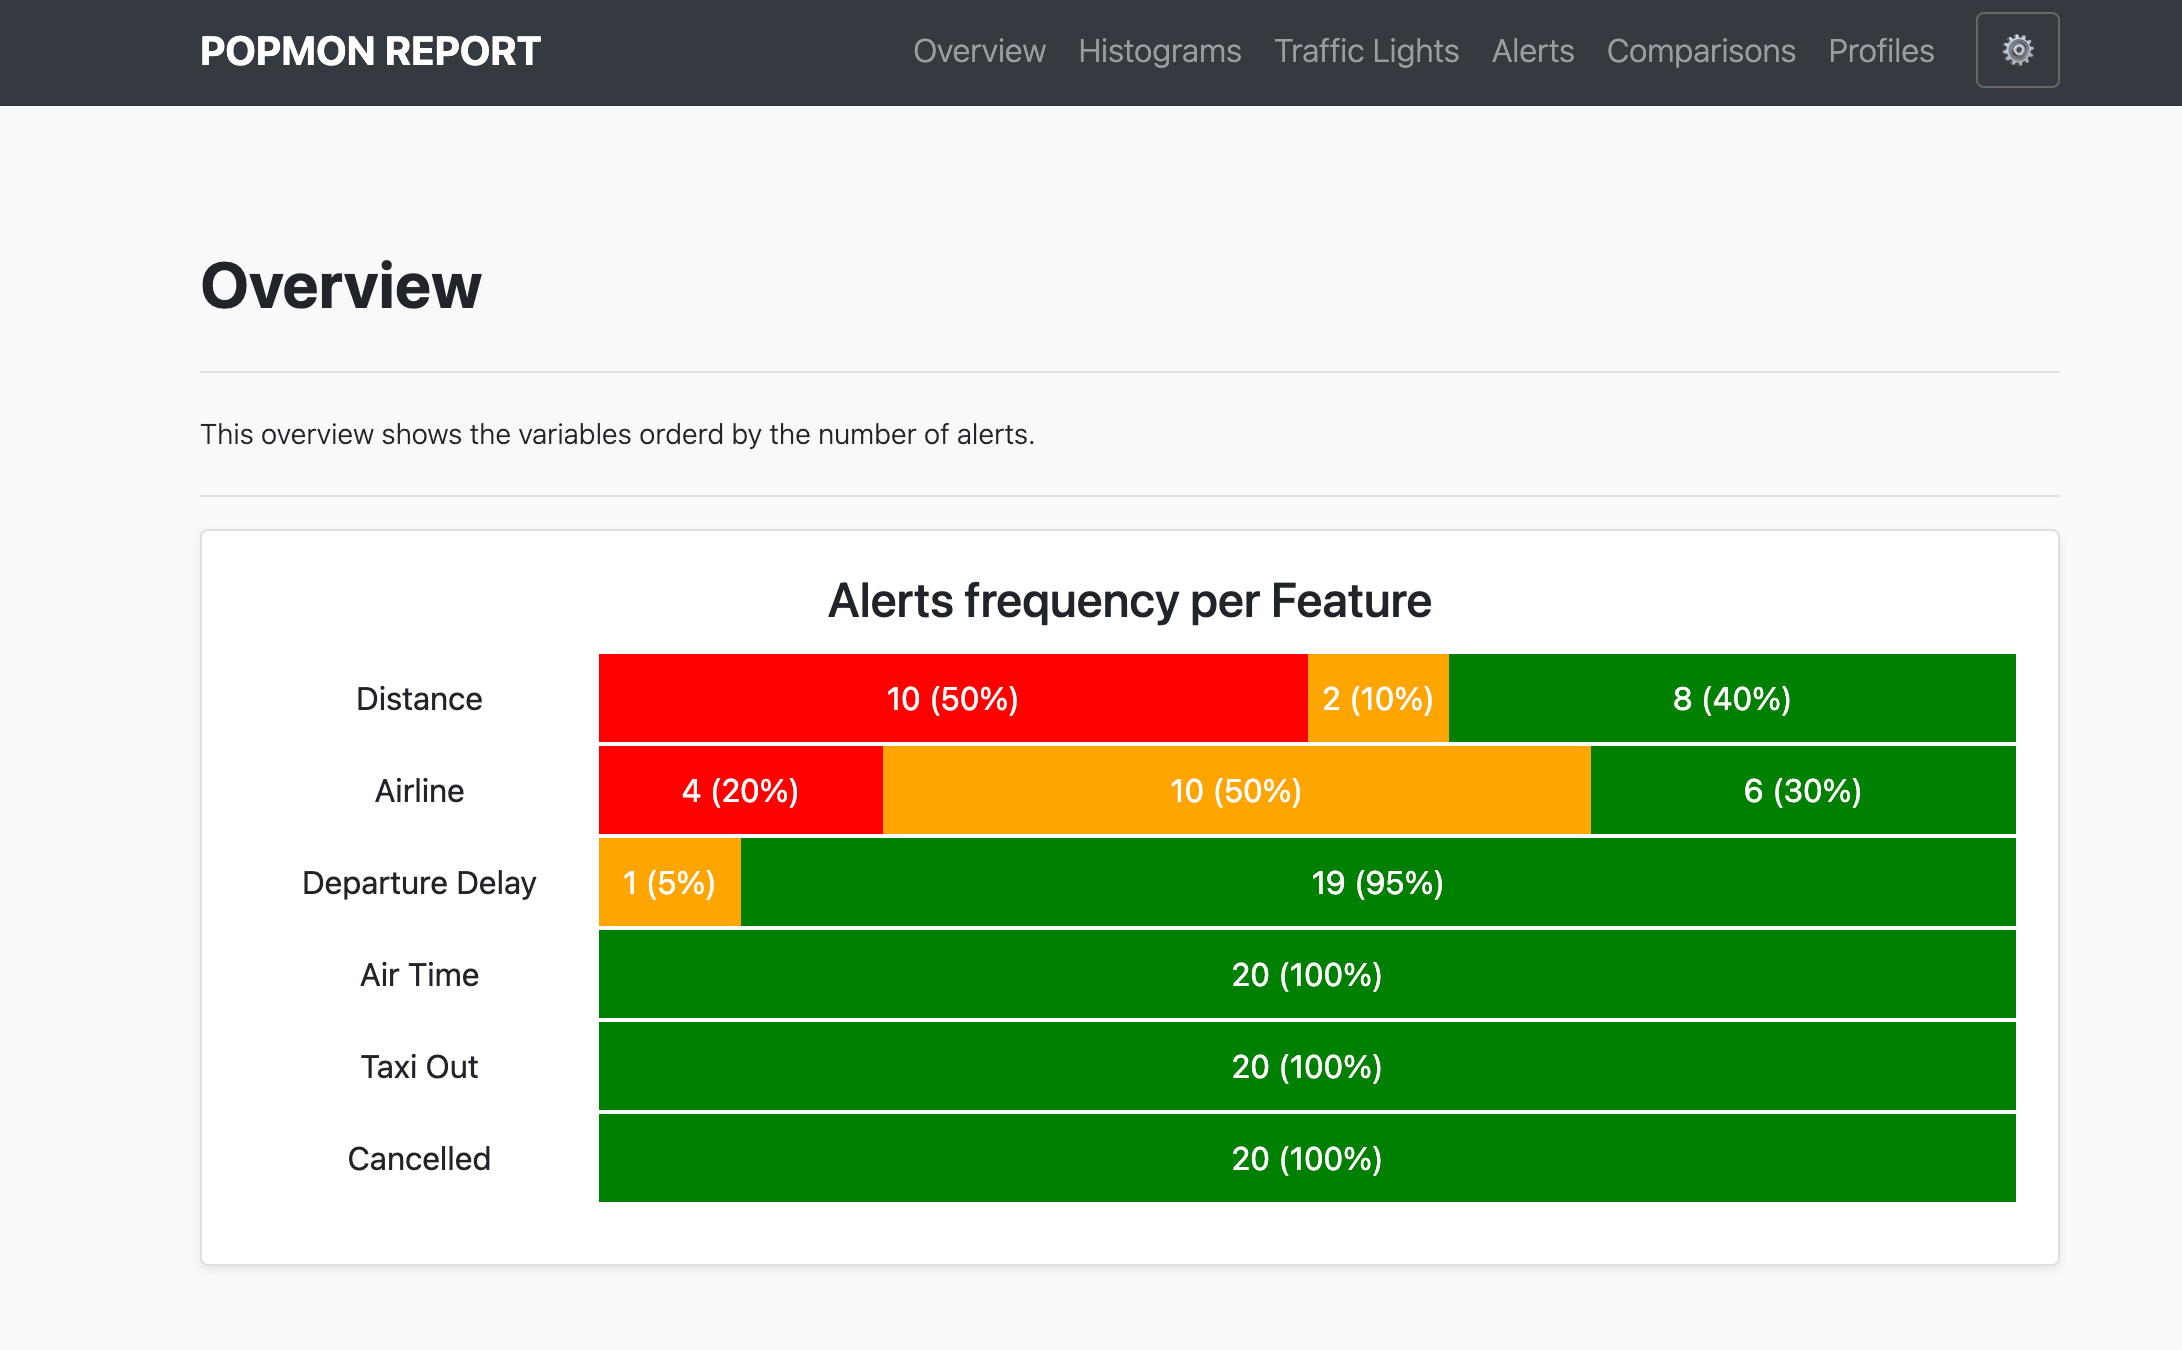
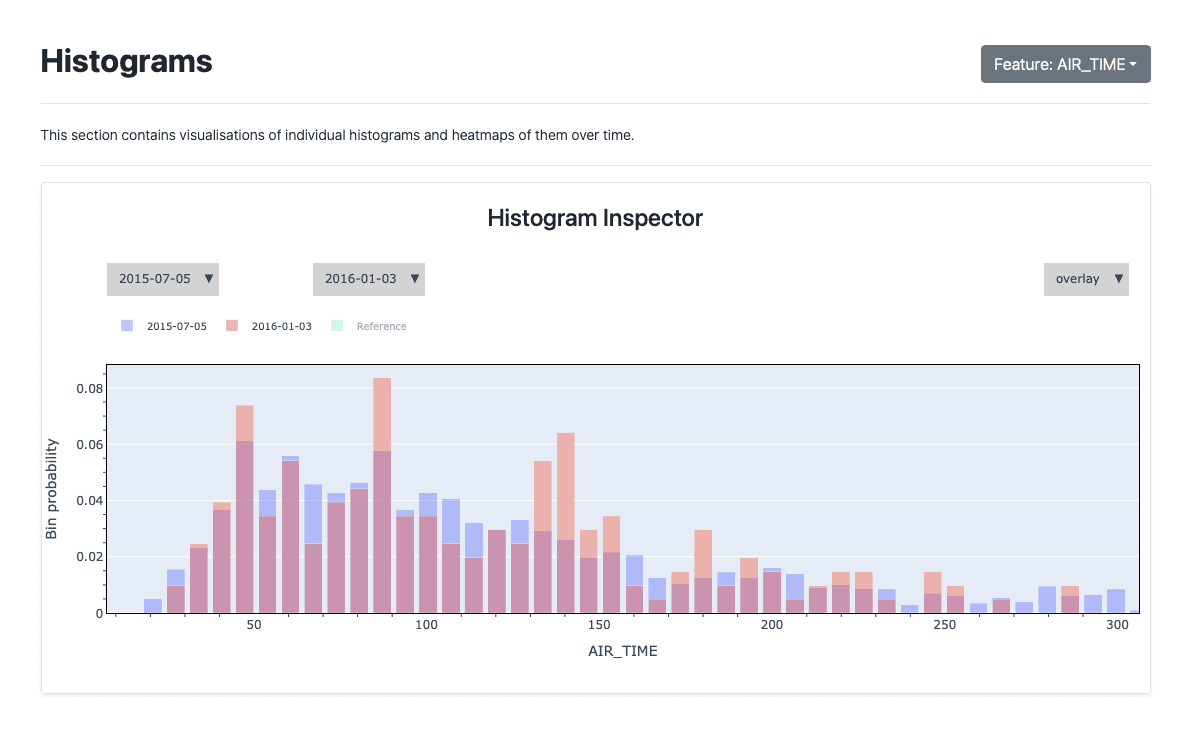
popmon creates histograms of features binned in time-slices, and compares the stability of the profiles and distributions of those histograms using statistical tests, both over time and with respect to a reference. It works with numerical, ordinal, categorical features, and the histograms can be higher-dimensional, e.g. it can also track correlations between any two features. popmon can automatically flag and alert on changes observed over time, such as trends, shifts, peaks, outliers, anomalies, changing correlations, etc, using monitoring business rules.
With Spark 3.0, based on Scala 2.12, make sure to pick up the correct histogrammar jar files:
spark = SparkSession.builder.config(
    "spark.jars.packages",
    "io.github.histogrammar:histogrammar_2.12:1.0.20,io.github.histogrammar:histogrammar-sparksql_2.12:1.0.20",
).getOrCreate()
For Spark 2.X compiled against scala 2.11, in the string above simply replace 2.12 with 2.11.
The entire popmon documentation including tutorials can be found at read-the-docs.
| Tutorial | Colab link |
|---|---|
| Basic tutorial | |
| Detailed example (featuring configuration, Apache Spark and more) | |
| Incremental datasets (online analysis) | |
| Report interpretation (step-by-step guide) |
The popmon library requires Python 3.6+ and is pip friendly. To get started, simply do:
$ pip install popmonor check out the code from our GitHub repository:
$ git clone https://github.com/ing-bank/popmon.git
$ pip install -e popmon
where in this example the code is installed in edit mode (option -e).
You can now use the package in Python with:
import popmonCongratulations, you are now ready to use the popmon library!
As a quick example, you can do:
import pandas as pd
import popmon
from popmon import resources

# open synthetic data
df = pd.read_csv(resources.data("test.csv.gz"), parse_dates=["date"])
df.head()

# generate stability report using automatic binning of all encountered features
# (importing popmon automatically adds this functionality to a dataframe)
report = df.pm_stability_report(time_axis="date", features=["date:age", "date:gender"])

# to show the output of the report in a Jupyter notebook you can simply run:
report

# or save the report to file
report.to_file("monitoring_report.html")
To specify your own binning specifications and features you want to report on, you do:
# time-axis specifications alone; all other features are auto-binned.
report = df.pm_stability_report(
    time_axis="date", time_width="1w", time_offset="2020-1-6"
)

# histogram selections. Here 'date' is the first axis of each histogram.
features = [
    "date:isActive",
    "date:age",
    "date:eyeColor",
    "date:gender",
    "date:latitude",
    "date:longitude",
    "date:isActive:age",
]

# Specify your own binning specifications for individual features or combinations thereof.
# This bin specification uses open-ended ("sparse") histograms; unspecified features get
# auto-binned. The time-axis binning, when specified here, needs to be in nanoseconds.
bin_specs = {
    "longitude": {"bin_width": 5.0, "bin_offset": 0.0},
    "latitude": {"bin_width": 5.0, "bin_offset": 0.0},
    "age": {"bin_width": 10.0, "bin_offset": 0.0},
    "date": {
        "bin_width": pd.Timedelta("4w").value,
        "bin_offset": pd.Timestamp("2015-1-1").value,
    },
}

# generate stability report
report = df.pm_stability_report(features=features, bin_specs=bin_specs, time_axis=True)
These examples also work with spark dataframes. You can see the output of such example notebook code here. For all available examples, please see the tutorials at read-the-docs.
Advanced users can leverage popmon's modular data pipeline to customize their workflow. Visualization of the pipeline can be useful when debugging, or for didactic purposes. There is a script included with the package that you can use. The plotting is configurable, and depending on the options you will obtain a result that can be used for understanding the data flow, the high-level components and the (re)use of datasets.
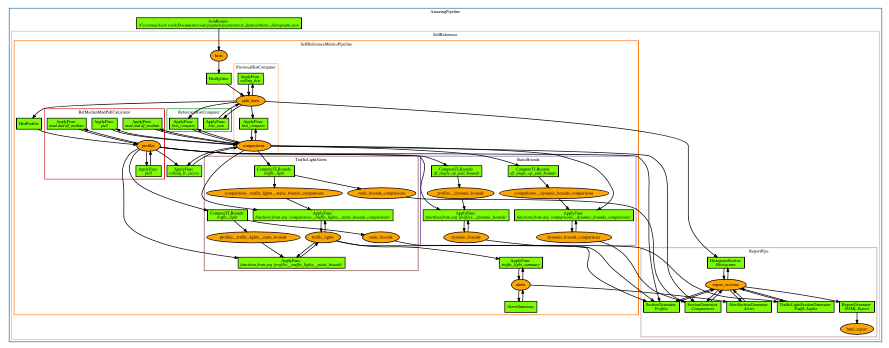
Example pipeline visualization (click to enlarge)
The data shift computations that popmon performs, are by default displayed in a self-contained HTML report. This format is favourable in many real-world environments, where access may be restricted. Moreover, reports can be easily shared with others.
Access to the datastore means that its possible to integrate popmon in almost any workflow. To give an example, one could store the histogram data in a PostgreSQL database and load that from Grafana and benefit from their visualisation and alert handling features (e.g. send an email or slack message upon alert). This may be interesting to teams that are already invested in particular choice of dashboarding tool.
Possible integrations are:
 |
|
| Grafana | Kibana |
Resources on how to integrate popmon are available in the examples directory. Contributions of additional or improved integrations are welcome!
External libraries or custom functionality can be easily added to Profiles and Comparisons. If you developed an extension that could be generically used, then please consider contributing it to the package.
Popmon currently integrates:
A Python/C++ implementation of Hartigan & Hartigan's dip test for unimodality. The dip test tests for multimodality in a sample by taking the maximum difference, over all sample points, between the empirical distribution function, and the unimodal distribution function that minimizes that maximum difference. Other than unimodality, it makes no further assumptions about the form of the null distribution.
To enable this extension install diptest using pip install diptest or pip install popmon[diptest].
| Title | Host | Date | Speaker |
| popmon: Analysis Package for Dataset Shift Detection | SciPy Conference 2022 | July 13, 2022 | Simon Brugman |
| Popmon - population monitoring made easy | Big Data Technology Warsaw Summit 2021 | February 25, 2021 | Simon Brugman |
| Popmon - population monitoring made easy | Data Lunch @ Eneco | October 29, 2020 | Max Baak, Simon Brugman |
| Popmon - population monitoring made easy | Data Science Summit 2020 | October 16, 2020 | Max Baak |
| Population Shift Monitoring Made Easy: the popmon package | Online Data Science Meetup @ ING WBAA | July 8 2020 | Tomas Sostak |
| Popmon: Population Shift Monitoring Made Easy | PyData Fest Amsterdam 2020 | June 16, 2020 | Tomas Sostak |
| Popmon: Population Shift Monitoring Made Easy | Amundsen Community Meetup | June 4, 2020 | Max Baak |
| Title | Date | Author |
| POPMON v1.0.0: The Dataset-Shift Pokémon | Aug 3, 2022 | Pradyot Patil |
| Monitoring Model Drift with Python | April 16, 2022 | Jeanine Schoonemann |
| The Statistics Underlying the Popmon Hood | April 15, 2022 | Jurriaan Nagelkerke and Jeanine Schoonemann |
| popmon: code breakfast session | November 9, 2022 | Simon Brugman |
| Population Shift Analysis: Monitoring Data Quality with Popmon | May 21, 2021 | Vito Gentile |
| Popmon Open Source Package — Population Shift Monitoring Made Easy | May 20, 2020 | Nicole Mpozika |
- Kedro-popmon is a plugin to integrate popmon reporting with kedro. This plugin allows you to automate the process of popmon feature and output stability monitoring. Package created by Marian Dabrowski and Stephane Collot.
This package was authored by ING Analytics Wholesale Banking (INGA WB). Special thanks to the following people who have contributed to the development of this package: Ahmet Erdem, Fabian Jansen, Nanne Aben, Mathieu Grimal.
If popmon has been relevant in your work, and you would like to acknowledge the project in your publication, we suggest citing the following paper:
- Brugman, S., Sostak, T., Patil, P., Baak, M. popmon: Analysis Package for Dataset Shift Detection. Proceedings of the 21st Python in Science Conference. 161-168 (2022). (link)
In BibTeX format:
@InProceedings{ popmon-proc-scipy-2022,
  author    = { {S}imon {B}rugman and {T}omas {S}ostak and {P}radyot {P}atil and {M}ax {B}aak },
  title     = { popmon: {A}nalysis {P}ackage for {D}ataset {S}hift {D}etection },
  booktitle = { {P}roceedings of the 21st {P}ython in {S}cience {C}onference },
  pages     = { 161 - 168 },
  year      = { 2022 },
  editor    = { {M}eghann {A}garwal and {C}hris {C}alloway and {D}illon {N}iederhut and {D}avid {S}hupe },
}- Issues & Ideas & Support: https://github.com/ing-bank/popmon/issues
Please note that INGA WB provides support only on a best-effort basis.
Copyright INGA WB. popmon is completely free, open-source and licensed under the MIT license.


![pre-commit-ci[bot]](https://avatars.githubusercontent.com/u/66853113?size=120)


![dependabot-preview[bot]](https://avatars.githubusercontent.com/u/27856297?size=120)


