pyEnergyDiagrams
Installation
pip install pyenergydiagrams
Usage
from pyenergydiagrams import State, Diagram
import matplotlib.pyplot as plt
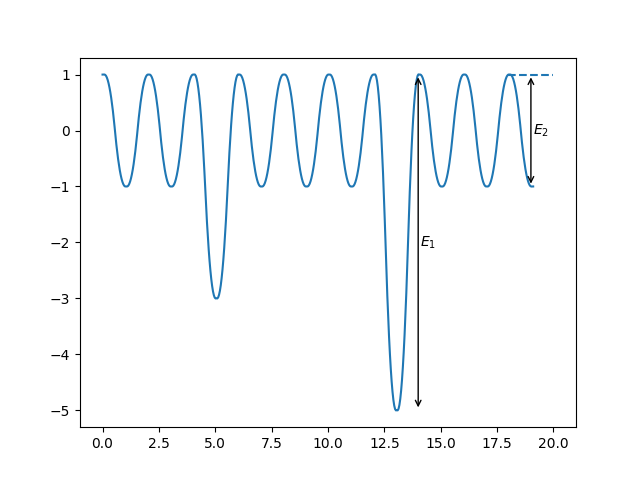
states = [State((-1) ** i) for i in range(20)]
states[5] = State(-3)
states[13] = State(-5)
my_diagram = Diagram(states)
plt.plot(my_diagram.x, my_diagram.y)
my_diagram.add_dotted_line(states[-2], dx_right=2)
my_diagram.add_arrow(states[14], states[13], "$E_1$")
my_diagram.add_arrow(states[-1], states[-2], "$E_2$")
plt.show()